Turning To Surface Quality Optimization
This article covers the fundamental principles of surface roughness and presents several tips proven to enhance surface quality in turning operations.n
This article covers the fundamental principles of surface roughness and presents several tips proven to enhance surface quality in turning operations.
Understanding Surface Quality
Surface quality, commonly referred to as surface roughness, provides a numerical value representing how smooth a surface appears. This measurement can be challenging since it converts a three-dimensional visual characteristic into a single numerical value.
Three primary approaches exist for obtaining surface roughness measurements.
- Mechanical Scanning: The most widely employed technique for measuring surface quality involves scanning the surface using a stylus that documents the microscopic peaks and valleys across a linear path. This measurement generates a profile (see Surface Finish Scan chart below) that undergoes mathematical analysis to produce a surface quality value.
- Visual Assessment: An older conventional approach involves comparing a surface visually against a reference set of various surface quality standards using human observation.
- Optical Digital Scanning: A high-resolution digital camera linked to a computer conducts an optical examination of a surface area and computes the surface quality.
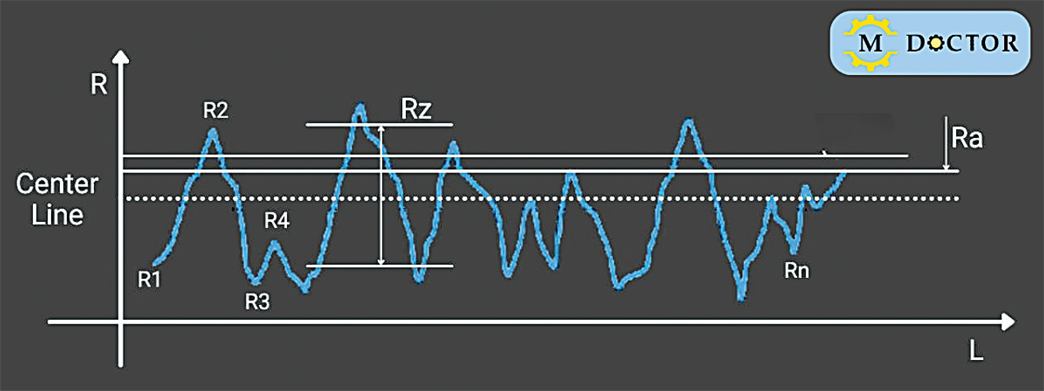 Surface Finish Scan
 Surface Quality Measurement Units
Multiple units exist for measuring surface quality, with Ra and Rz being the most widely used. Given the frequent confusion between these units, let’s clarify their differences.
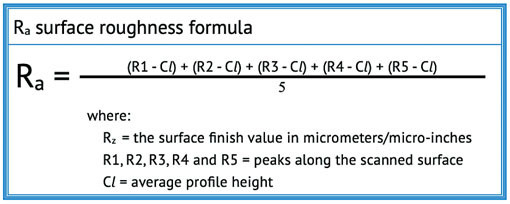
Ra, known as the roughness average, is the most frequently used unit. According to ASME B46.1, Ra represents the arithmetic mean of the absolute values of profile height variations from the centerline, measured within the evaluation length. Using the same parameters that correspond with those shown in the Surface Finish Scan chart, the calculation follows the formula shown above.
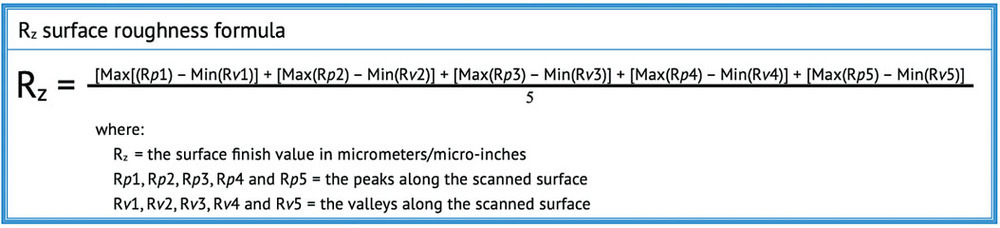
Rz, is the “Peak to Valley” average, and is the second most common unit. The calculation involves measuring the vertical distance between the highest peak and the lowest valley within the scanned profile. The top five peaks and the five deepest valleys are measured, and then these distances are averaged. Rz consistently produces higher values than Ra. The calculation uses the formula shown below.
A frequent question from machinists and engineers concerns the conversion of Ra to Rz values. Direct conversion from Ra to Rz (or Rz to Ra) is impossible since they represent different characteristics.
This would be like asking, “How can I convert height to weight?” Height cannot be converted directly to weight, but rough estimations based on statistical data are possible. For example, you can say with 99% probability that a 6-foot-tall person typically weighs between 140 and 290 pounds. Weights of 100 or 400 pounds would be highly unlikely.
For Ra to Rz conversions or vice versa, statistical analysis enables a reasonable prediction of the Rz range for a specific Ra value. You can use conversion charts or an online Ra/Rz conversion tool.
Review the print ads from this magazine to continue
This quick advertiser review unlocks the rest of the article and keeps the full-screen reader focused on the ads instead of the page chrome.

MFGAxis Discussion