


Chatter stability map: General Industry Coverage
Dear Doc: We cylindrical-plunge grind hardened-steel shafts. When we get chatter, some operators slow down the feedrate. Is this the right approach?
Dear Doc: We cylindrical-plunge grind hardened-steel shafts. When we get chatter, some operators slow down the feedrate. Is this the right approach?
The Doc replies: The answer is: “Probably not.” Except when finish grinding. Then, the answer is: “Maybe.” As always with chatter, things quickly get complicated.
The figure shows a “Folkerts-style Chatter Stability Map.” How is this map created? It’s complicated. But pretty much all cylindrical-plunge operations will produce a map that looks like this, albeit with different depths and rpms for the Chatter Danger Zone.
Let’s start with the green dot on the green curve – right on the edge of the Chatter Danger Zone. What should you do?
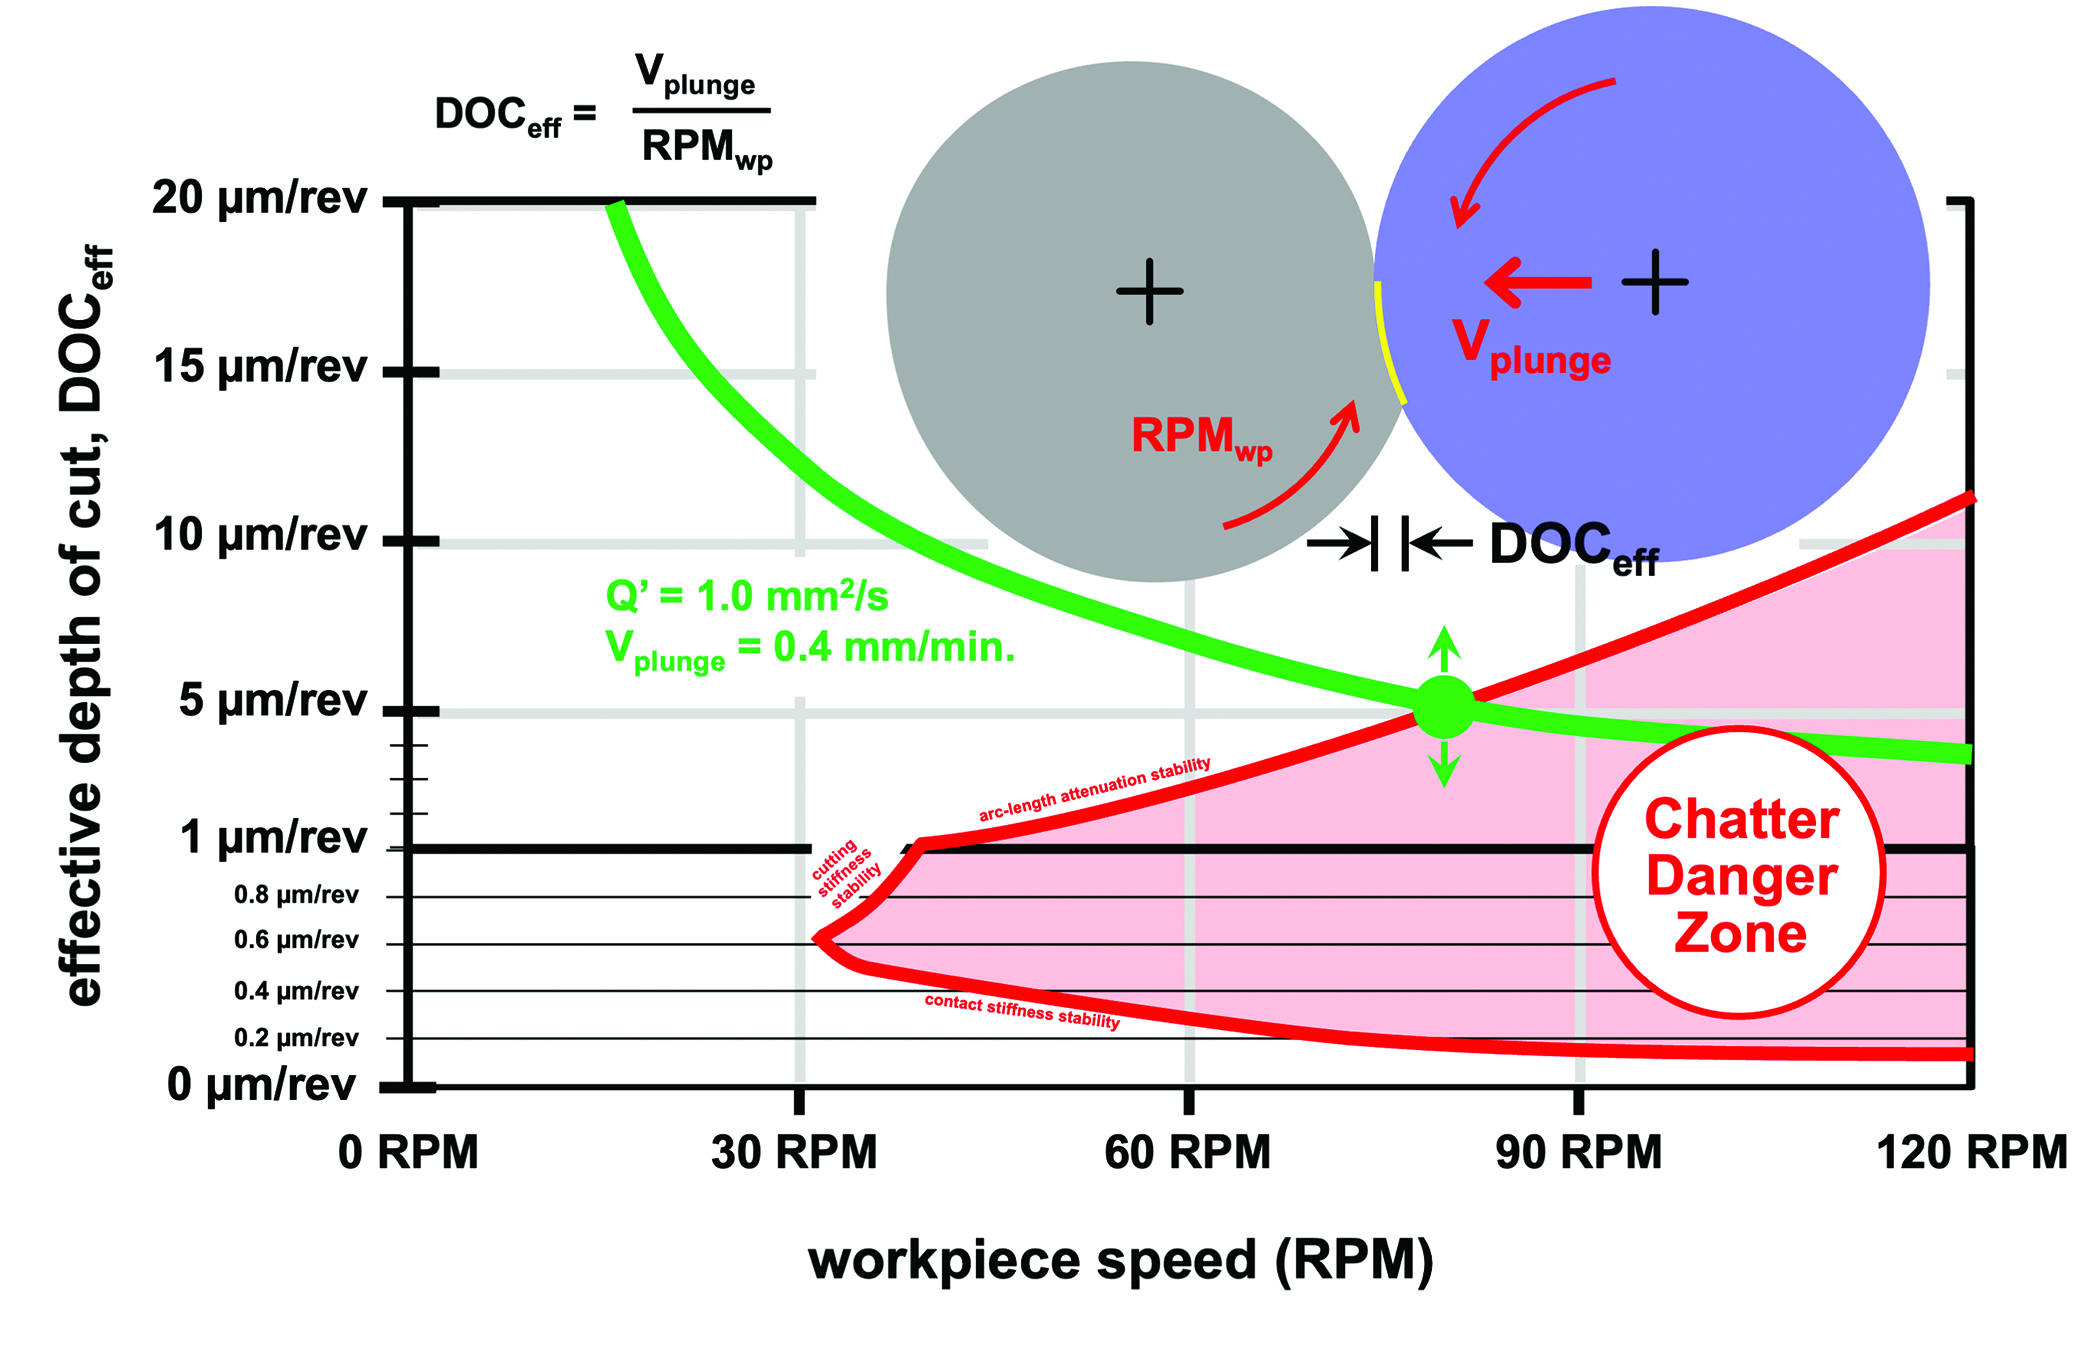
A chatter stability map. Image courtesy of J. Badger
As the wheel plunges into the workpiece, the workpiece material is rotating into the wheel (the yellow arc in the figure). For every revolution of the workpiece, the wheel has plunged in a certain depth. This is the effective depth of cut, calculated by: DOCeff = Vplunge/RPMwp. For the green dot, let’s say you’re plunging in at 0.4 mm/minute at 80 rpm. That’s an effective depth of cut of 5 mm. Now, if you have chatter and want to avoid the Chatter Danger Zone, what should you do?
Decreasing Vplunge will decrease DOCeff, taking you into the Danger Zone (green down-arrow). That’s bad. Increasing Vplunge will take you out of the Danger Zone (green up arrow). That’s good.
It’s counter-intuitive. But it’s correct. What do most grinders do when they get chatter? They slow down the plunge speed. Usually (except in finish grinding), that’s a bad idea.
What about workpiece rpm? According to the equation, if we decrease RPMwp, we increase DOCeff. That moves us up and to the left on the green curve, getting us further away from the Danger Zone. If we increase RPMwp, we decrease DOCeff. That moves us down and to the right on the green curve, putting us deeper into the Danger Zone.
So, if you have chatter when rough grinding, try slowing down your workpiece rpm. I can’t guarantee it’ll fix your chatter problem, but at least it’s going in the right direction.
What about finish grinding? Here, things get messy. When we finish-grind, we inevitably pass through the Danger Zone before getting out of it again (at very small DOCeff). So what should we do? Here, there’s no easy answer. You can: a) spend less time at small plunge speeds (getting through the Danger Zone more quickly), b) decrease the wheel speed, c) decrease the workpiece rpm (moving us to the left on the map), and/or d) switch to a resin-bonded wheel.
For both rough and finish grinding, decreasing your workpiece rpm is a reasonable option. Sometimes it works, sometimes it doesn’t. But at least you’ll be going in the right direction. In rough grinding, increasing your plunge speed can also help, contrary to what your intuition may tell you.
Finally, be careful. Both these options increase your workpiece temperature. Like I said, chatter gets complicated fast.
Glossary terms in this article
Related

Subscribers can use MFGAxis notes, saves and discussion tools with their innoNET account.