

2020 Salary Survey: Industry Trends & Analysis
The pandemic and social unrest seem to grab all the headlines, but manufacturing is an essential industry that continues to generate wealth for a sizable portion of the population and is worthy of news coverage.
 The pandemic and social unrest seem to grab all the headlines, but manufacturing is an essential industry that continues to generate wealth for a sizable portion of the population and is worthy of news coverage. However, compared with Cutting Tool Engineering’s biennial Benefits and Salary Survey from 2018, which showed an uptick in pay and benefits for all metalworking professionals on average over the previous two years, 2020’s survey paints a less rosy picture.
Across the board for all positions, salaries are either down a bit or, at least for programmers, about the same as two years earlier based on the national average. Similar to the previous 10 surveys, corporate managers make the most money. Nonetheless, their earnings saw a decline compared with 2018.
Regular CTE readers may notice that the presentation of the national average of salaries by position is different from previous surveys. CTE normally creates a web-based survey instrument using SurveyMonkey and then emails the link to subscribers who have access to companywide salary information. This year, in addition to the usual method, CTE utilized a paid data collection option whereby SurveyMonkey conducted surveys using its own survey panels that targeted the manufacturing industry. To ensure that the difference in respondents by company types did not significantly impact salary results, CTE weighted 2020’s sample to match the company type proportions from 2018’s survey. When comparing average salaries across the unweighted and weighted samples, no meaningful differences were found.
The national average presentation below breaks out companywide results from 103 subscribers, 236 results collected by the survey service and the combined results. However, to provide a more apples-to-apples comparison for salaries by region, company size and company type, as well as benefits provided, the other graphs contain only the results gathered from subscribers.
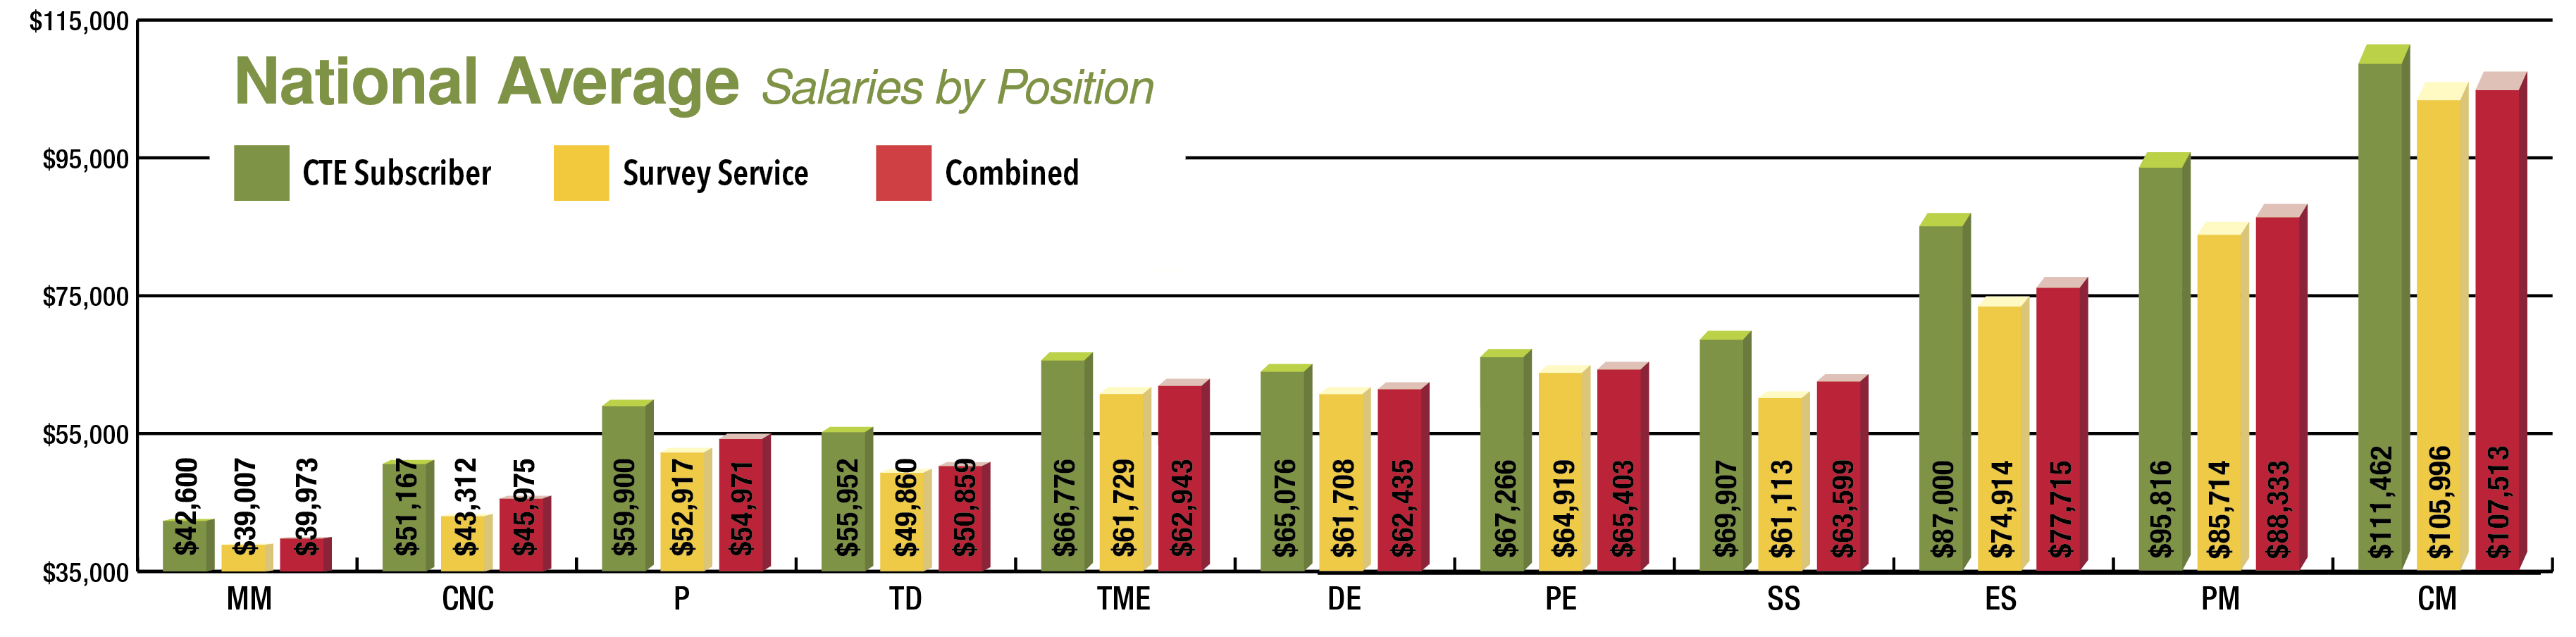 Chart Key: MM: Manual Machinist; CNC: CNC Machinist; P: Programmer; TD: Tool and Die Maker; TME: Tool/Manufacturing Engineer; DE: Design Engineer; PE: Project Engineer; SS: Shop Supervisor; ES: Engineering Supervisor; PM: Plant Manager; CM: Corporate Manager
For nonweighted results, average salary was calculated according to the arithmetic mean. For instance, if four respondents indicated that their CNC machinists earn average annual salaries of $46,000, $59,000, $53,000 and $51,000, the mean would equal $52,250; (46,000 + 59,000 + 53,000 + 51,000) ÷ 4 = 52,250.
Review the print ads from this magazine to continue
This quick advertiser review unlocks the rest of the article and keeps the full-screen reader focused on the ads instead of the page chrome.
Advertisers included in this article experience
Print placements connected to this article
Marucit
NEW FEATURES! Citizen’s
M32 and L12 Swiss Type Lathes TYPE X L12 Y2 axis on the back spindle Modular tooling system increases number of useable rotary tools Built-in motor type back spindle Maximum spindle speed increased to 12,000 rpm 16mm oversize EXPERIENCE THE THE DIFFERENCE specification option Enhanced rigidity Allendale, NJ Elk Grove Village, IL Fountain Valley, CA Agawam, MA.
NEW FEATURES! Citizen’s M32 and L12 Swiss Type Lathes TYPE X L12 Y2 axis on the back spindle Modular tooling system increases number of useable rotary tools
Visit Marucit View this placement in the issue recordPrint ads from this magazine
M32 and L12 Swiss Type Lathes TYPE X L12 Y2 axis on the back spindle Modular tooling system increases number of useable rotary tools Built-in motor type back spindle Maximum spindle speed increased to 12,000 rpm 16mm oversize EXPERIENCE THE THE DIFFERENCE specification option Enhanced rigidity Allendale, NJ Elk Grove Village, IL Fountain Valley, CA Agawam, MA.
NEW FEATURES! Citizen’s M32 and L12 Swiss Type Lathes TYPE X L12 Y2 axis on the back spindle Modular tooling system increases number of useable rotary tools
Continue reading
August 2020
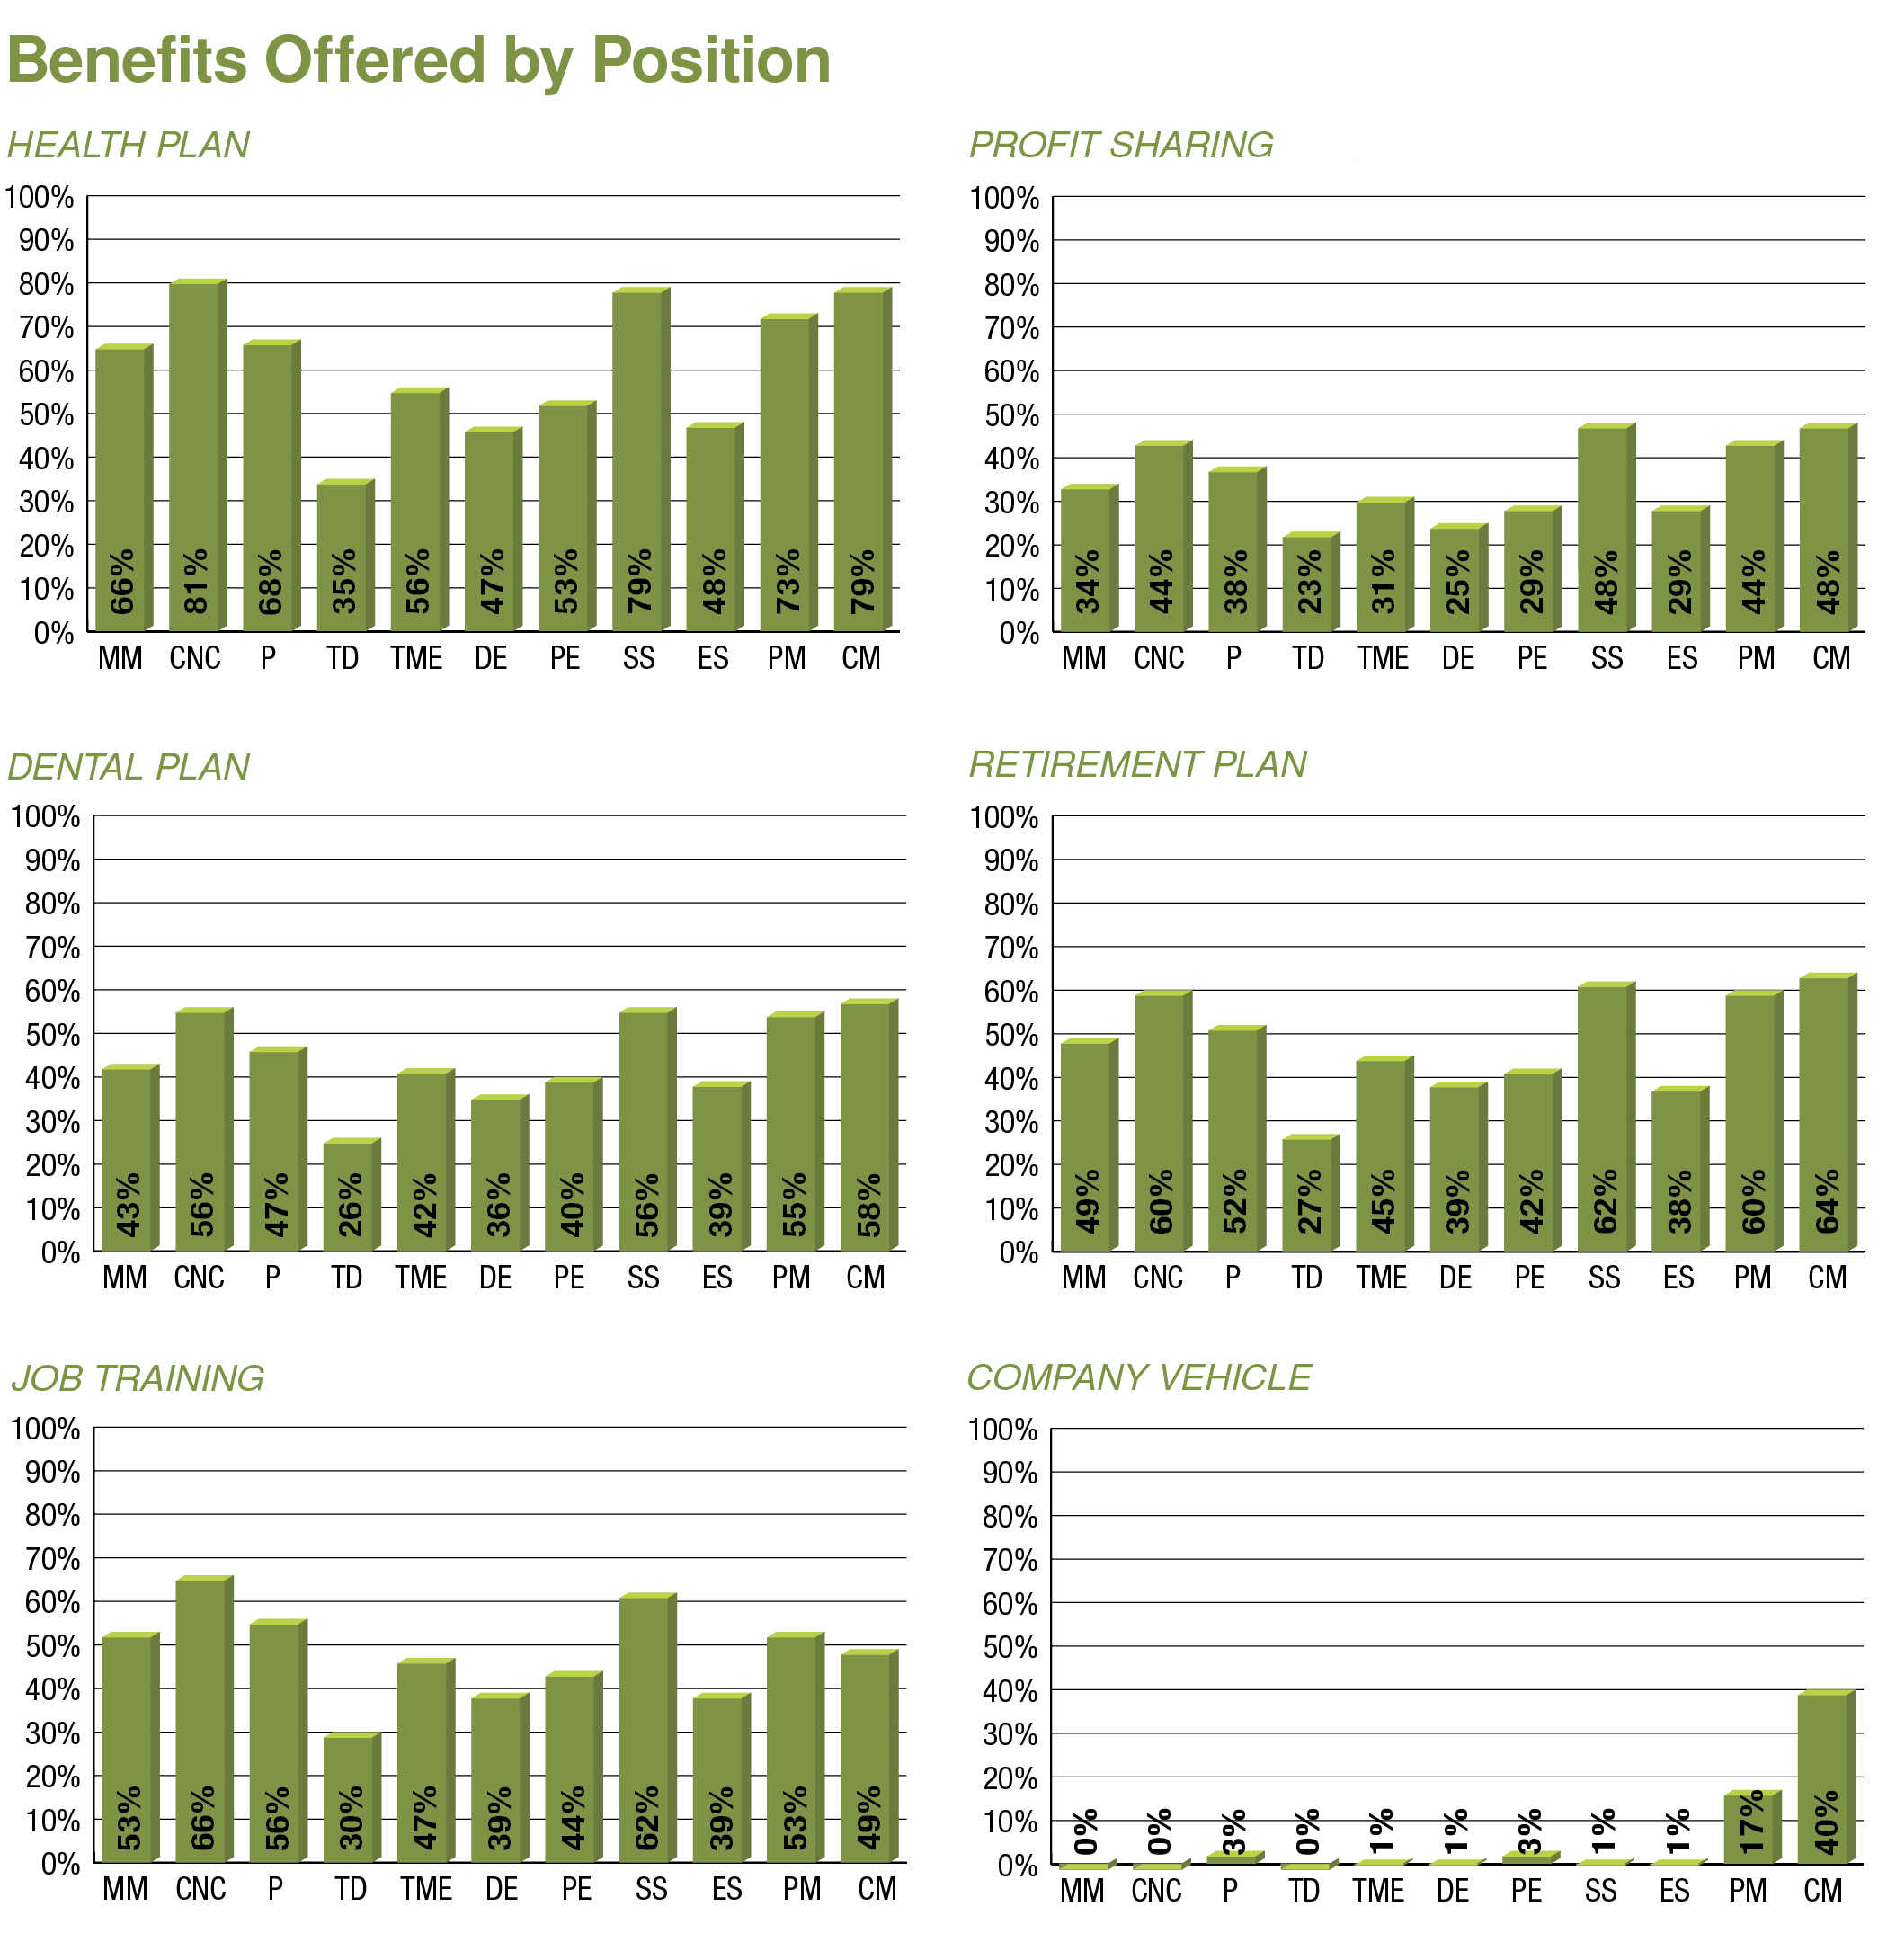
Benefit percentages were calculated by dividing the total number of positive results for a specific benefit by the total number of respondents. For example, if 55 respondents indicated that their project engineers receive a company-paid health plan, the percentage receiving that benefit would be 53% (55 ÷ 103 = 0.534).
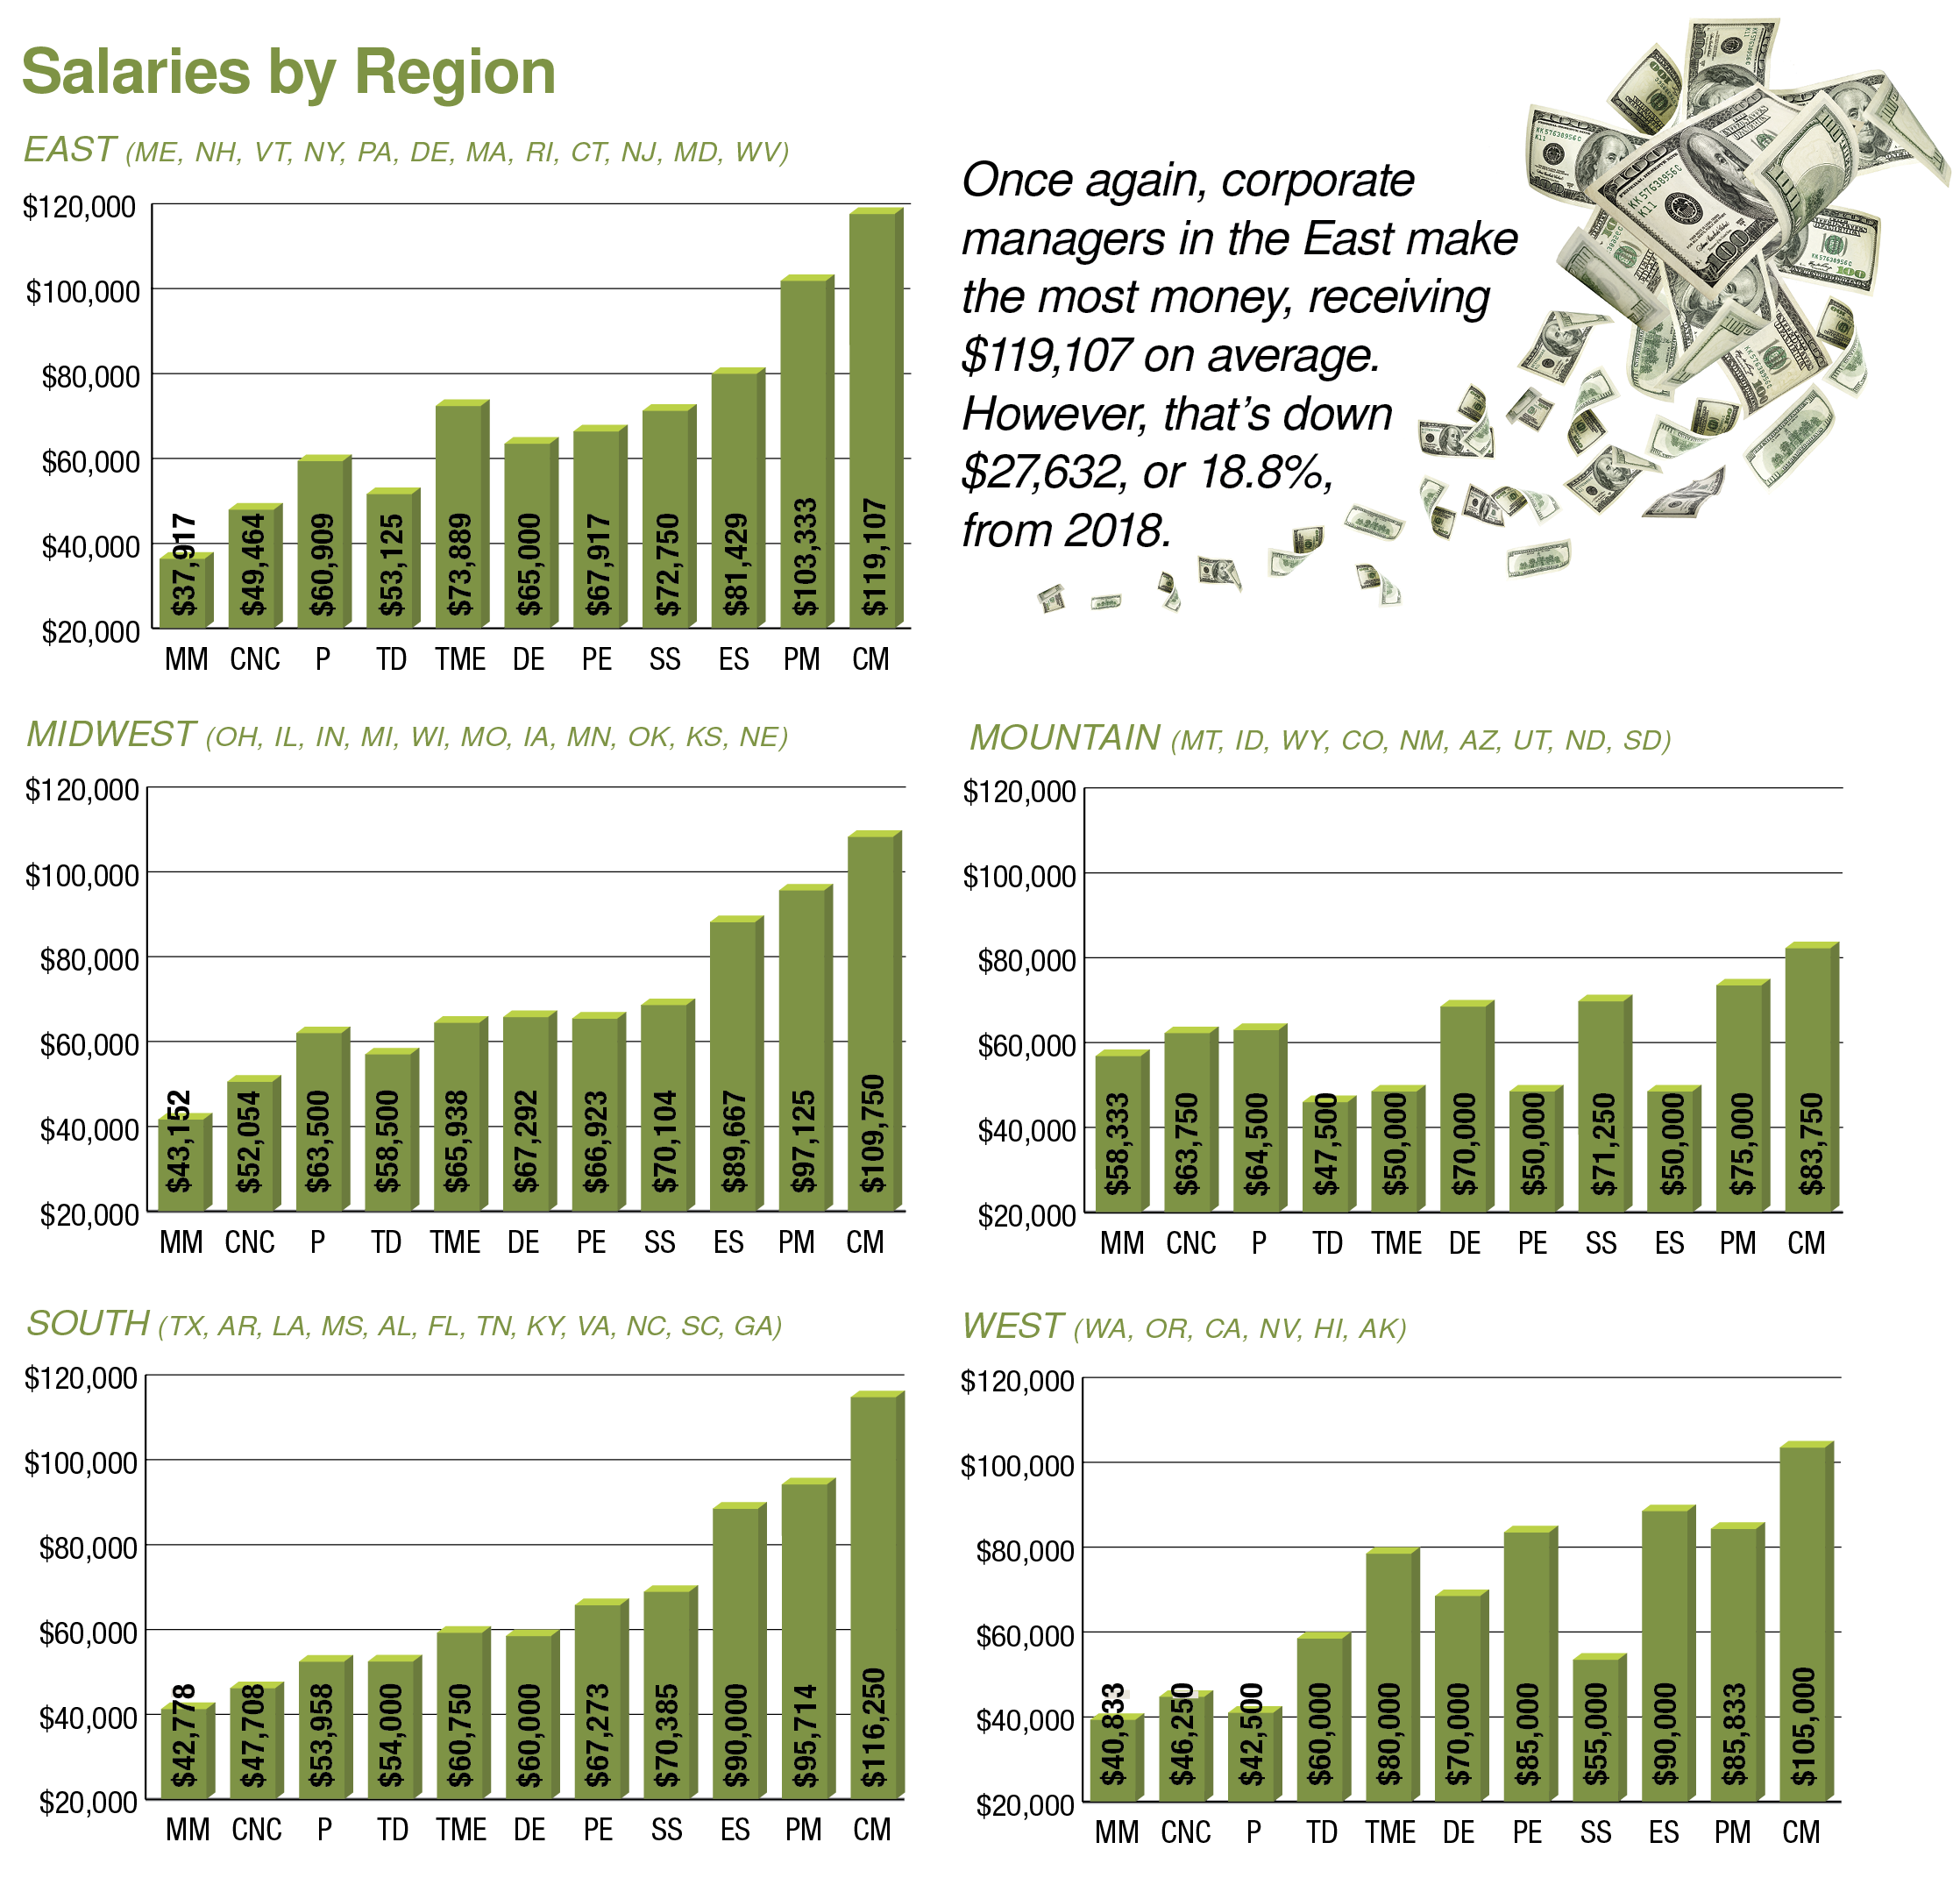
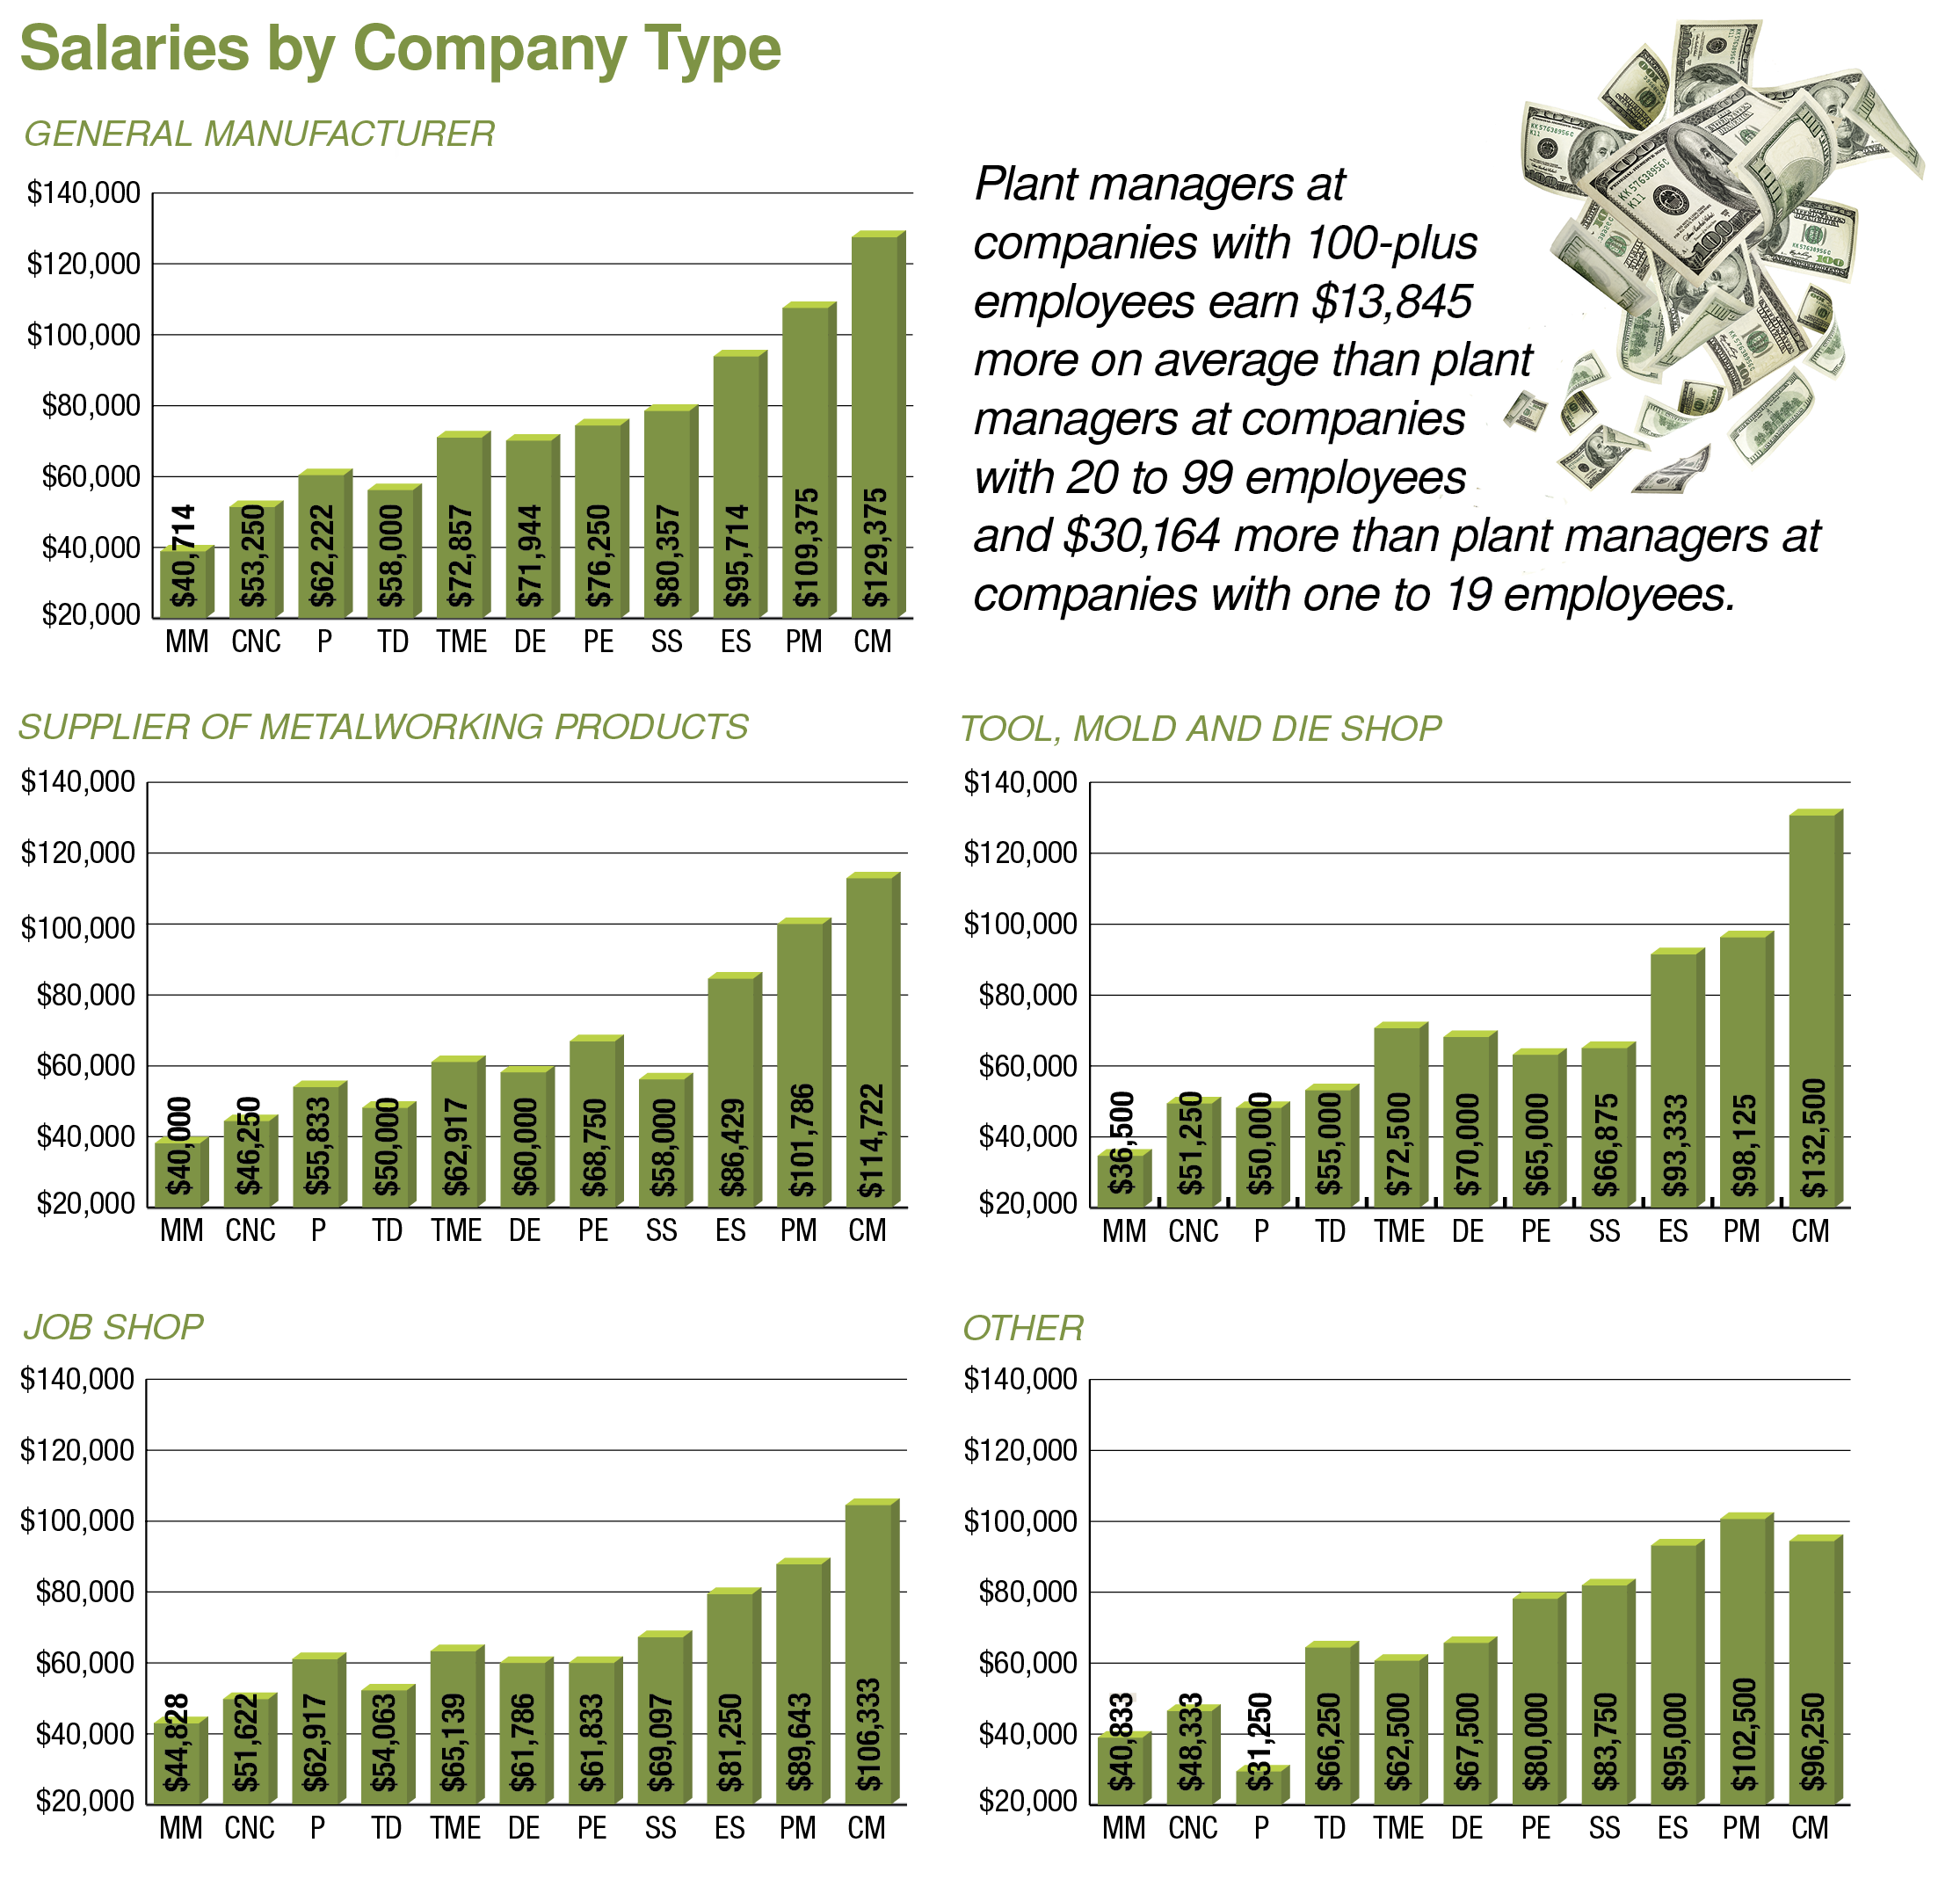
As is typical, not all regions and company types followed the national average’s pay reduction. For example, while manual machinists in the East and South regions are experiencing lower levels of compensation than two years ago, those working in the same position in the Midwest, Mountain and West regions have seen an increase. Likewise, corporate managers at general manufacturers and suppliers of metalworking products have increased salaries while those at other types of manufacturing companies make less.
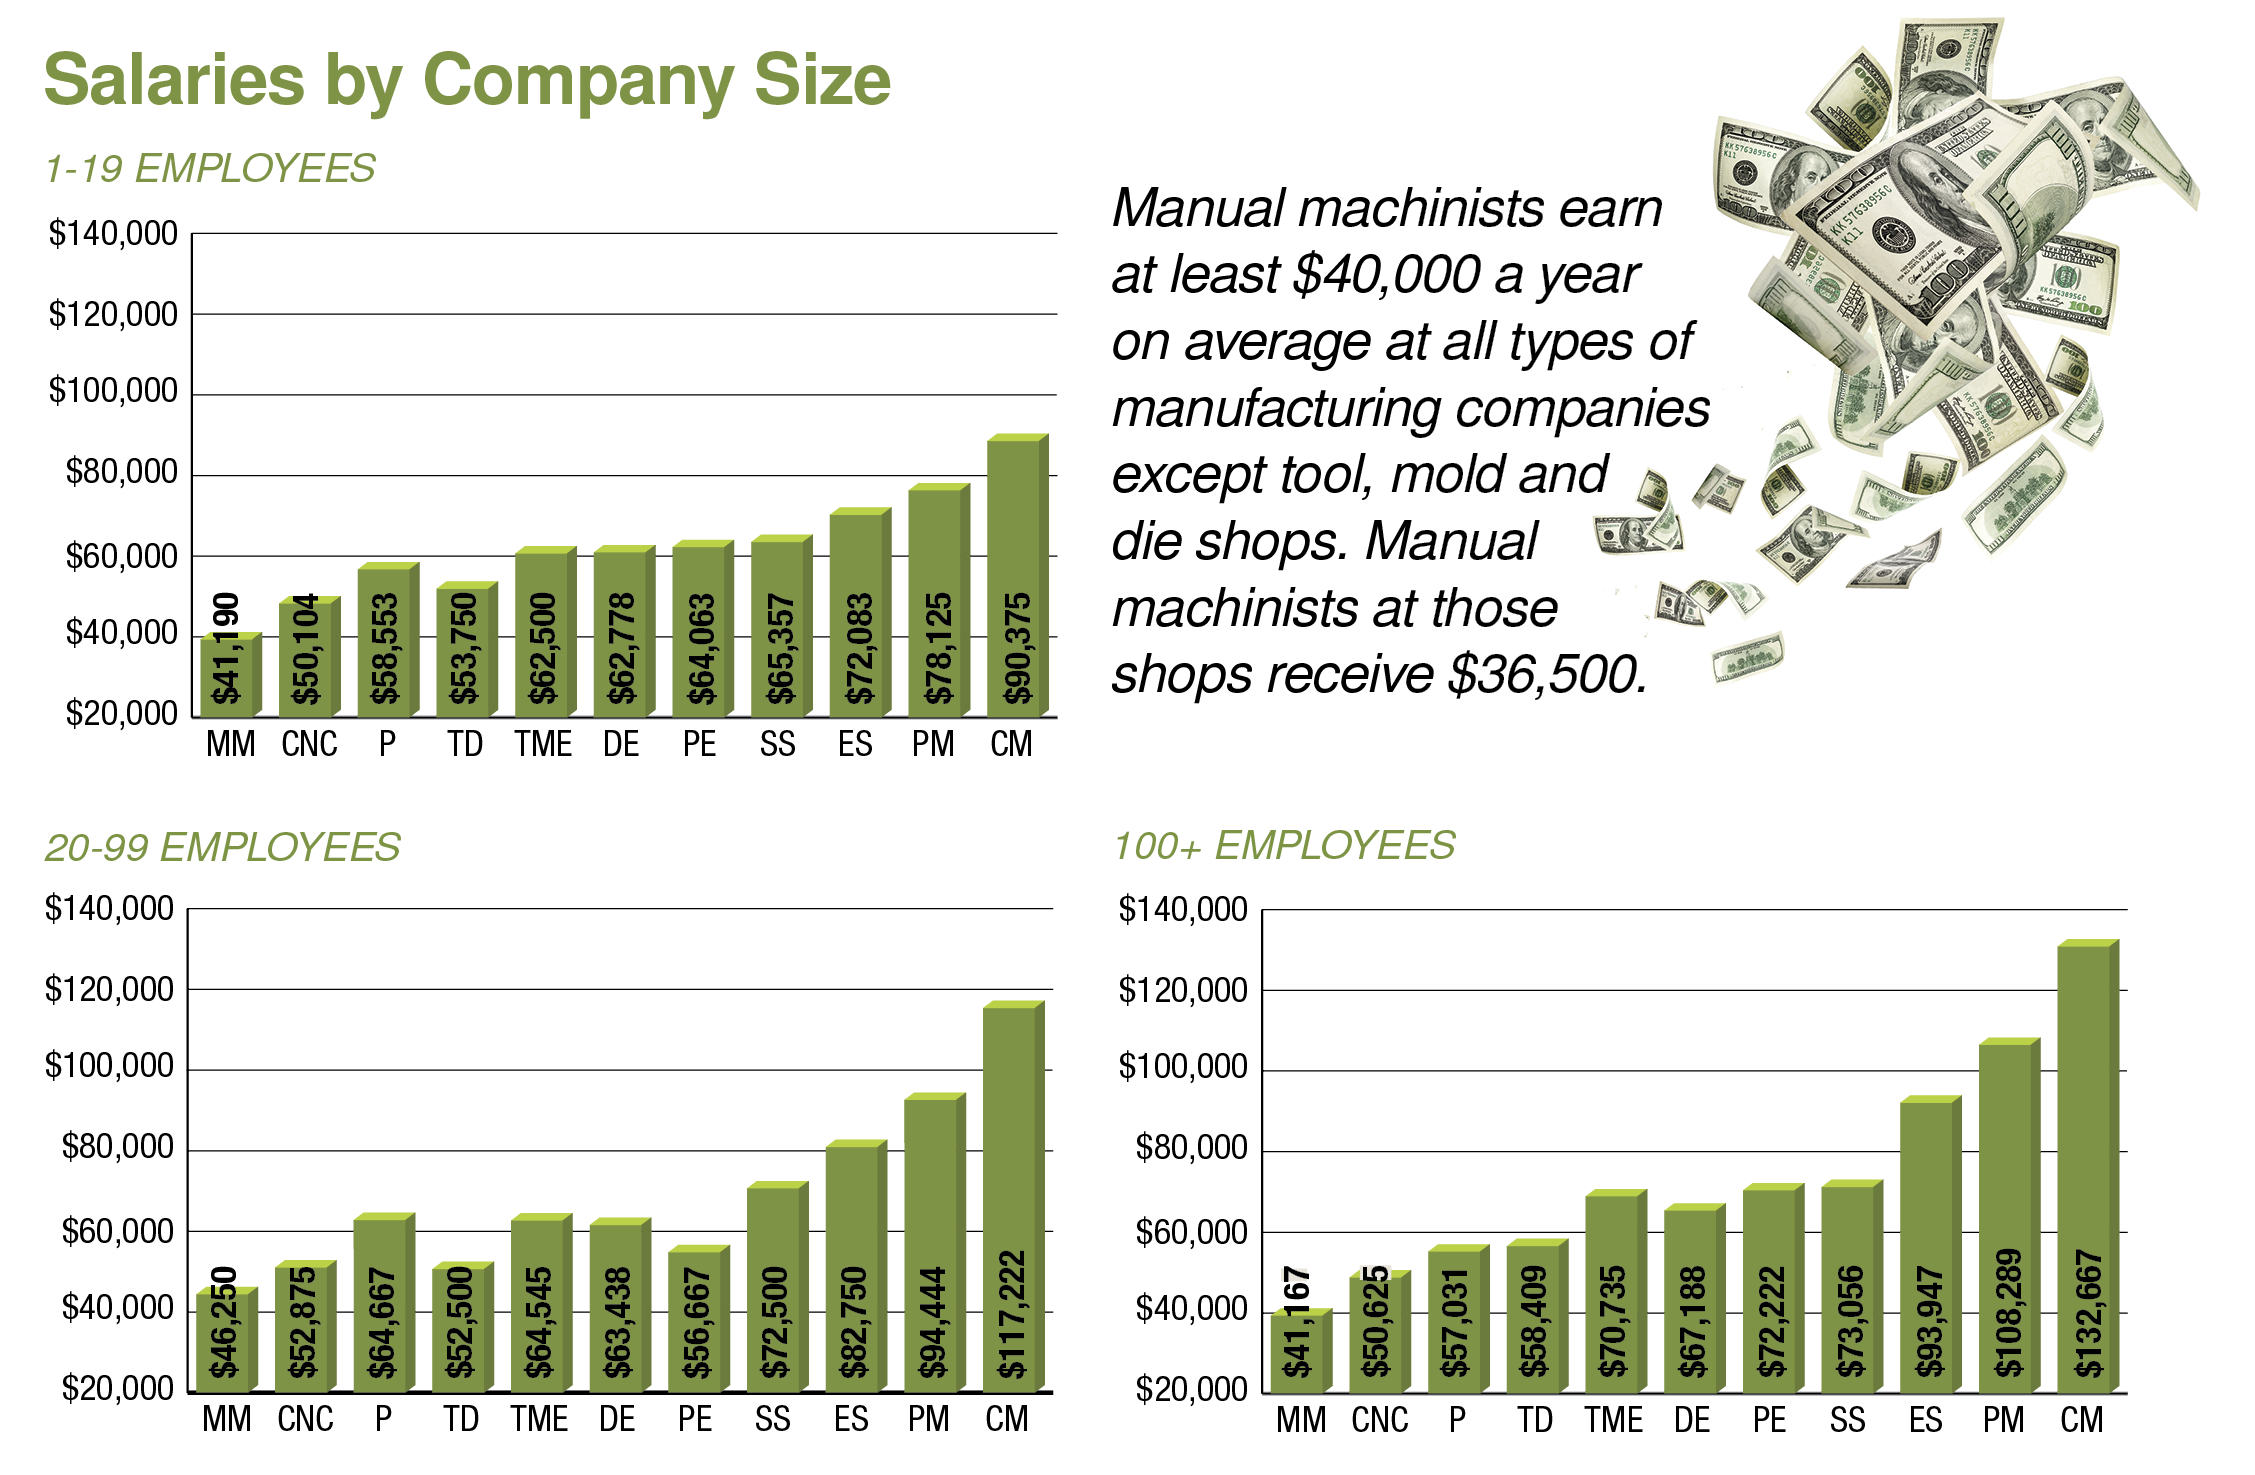
Most positions at companies with 20 or more employees see pay cuts, but eight positions at companies with one to 19 employees make more money: 7.5% more for CNC machinists, 10.6% more for programmers, 9.1% more for tool and die makers, 8.4% more for tool/manufacturing engineers, 11.6% more for design engineers, 6.3% more for project engineers, 11.6% more for shop supervisors and 6.2% more for engineering supervisors.
When it comes to benefits, nearly all positions receive fewer health, dental, retirement and company vehicle benefits, with the exception of corporate managers. Except for a dental plan (down 7%) and a retirement plan, which remains about the same, 1.2% more corporate managers receive a health plan and 14% more receive a company vehicle compared with 2018.
Nonetheless, eight out of 11 positions see increases in profit sharing and receive more job training.
Related


Subscribers can use MFGAxis notes, saves and discussion tools with their innoNET account.