Counting Dollars
Counting Dollars
Salaries earned by metalworking professionals, including machinists, production engineers, manufacturing engineers and corporate managers. Salaries are broken down by region, size of company and type of shop or manufacturing facility.
CTE's first salary survey shows you the money.
Nineteenth century naturalist Jean Louis Agassiz once said, "I cannot afford to waste my time making money." Unlike Agassiz, people in the metalworking and machining industry cannot afford to waste their time not making money. And to determine how much they make, CUTTING TOOL ENGINEERING conducted a salary survey.
To collect the data, CTE mailed questionnaires to 2,000 senior managers and company owners, requesting information about the salaries and benefits for themselves and the employees they oversee. The questionnaire also asked for information about the company's location, number of employees and type of operation.
The survey was anonymous and 701 completed questionnaires were returned, a 35 percent response rate.
The questionnaire asked five questions:
- Where is your company located?
- How many people does your company employ?
- Which of the following best describes your company (Job Shop; Mold Shop; Supplier of Metalworking Products; General Manufacturer; Tool & Die Shop; Other)?
- Check the average annual salary earned by employees at your company who hold the following positions: Manual Machinist; CNC Machinist; Programmer; Tool & Die Maker; Tool/Manufacturing Engineer; Design Engineer; Project Engineer; Shop Supervisor; Engineering Supervisor; Plant Management; Corporate Management. The salary ranges were: Less than $30,000; $30,001 to $35,000; $35,001 to $40,000; $40,001 to $45,000; $45,001 to $50,000; $50,001 to $60,000; $60,001 to $70,000; $70,001 to $80,000; $80,001 to $90,000; $90,001 to $100,000; More than $100,000.
- What benefits does your company provide?
Survey Methodology
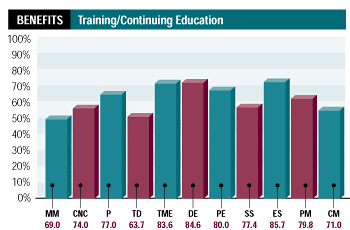
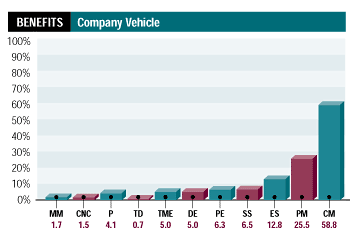
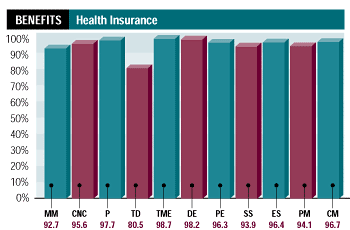
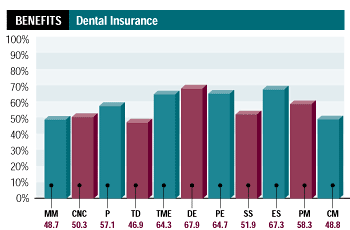
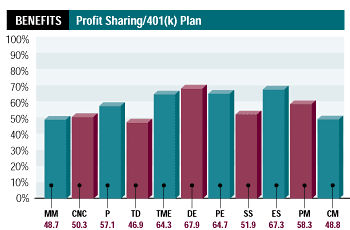
After the responses were collected, the information was sorted to provide the average salary range of each position by region, company size, number of employees and type of company. The data also was used to determine the national average salary range for each position, as well as the percentage of benefits that each position receives.
CTE then calculated the average salary range by taking the number of check marks indicated for each position's salary range, multiplying that number by the salary range's weighted number from 1 to 11 (where less than $30,000 equals 1 and more than $100,000 equals 11), adding up the multiplied figures and dividing that sum by the total number of responses for each position.
For example, let's say there were responses from five companies in region X for manual machinists. Two companies responded that the average salary range for their manual machinists is between $30,001 and $35,000 (salary range 2), one company pays $35,001 to $40,000 (range 3) and two companies pay $40,001 to $45,000 (range 4). The calculation would then appear as [(2x2) + (1x3) + (2x4)] ÷ 5 = 3. Therefore, the average salary range for manual machinists in region X is $35,001 to $40,000, which is range 3.
Of course, only a few of the calculations resulted in a whole number. For instance, the average salary-range number for a tool and die maker in the Mountain region was determined to be 5.44. This means that more companies pay these workers $45,000 to $50,000 (range 5) than those that pay $50,001 to $60,000 (range 6).
Compared to the average salary range for tool and die makers in the South Atlantic region (3.00 or $35,001 to $40,000), those holding similar positions in the Mountain region are, on average, earning more money.
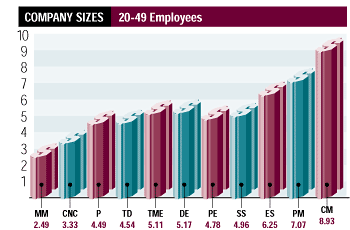
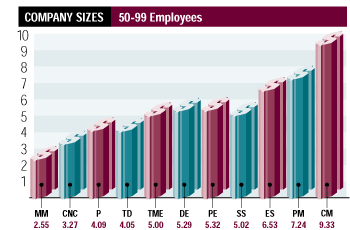
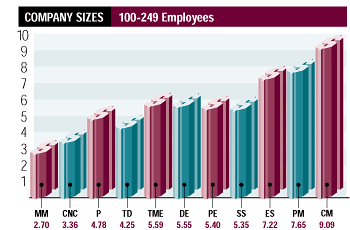
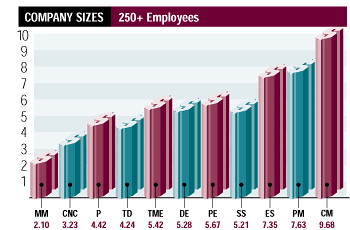
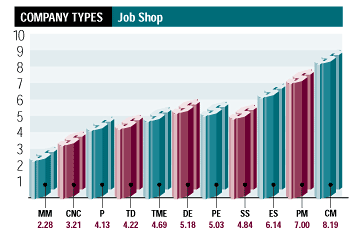
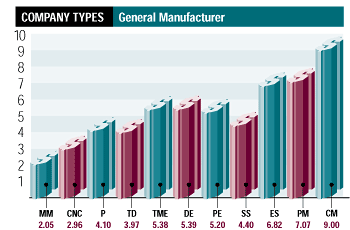
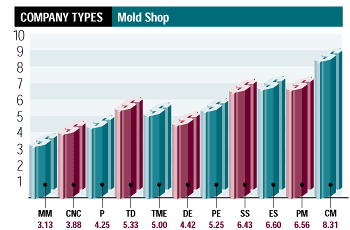
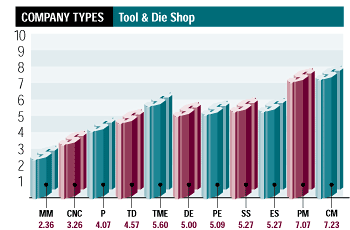
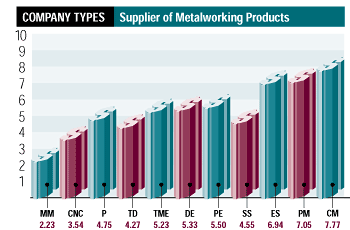
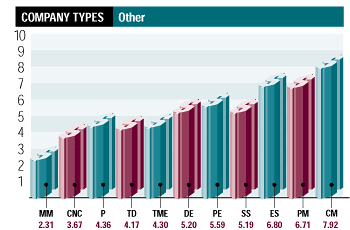
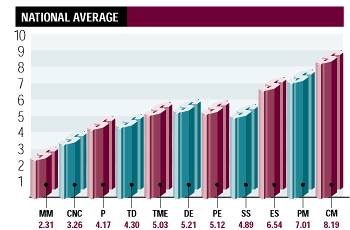
To indicate how a particular position's salary compares by region, company size and company type, the vertical axis displays 10 salary-range points, and printed with each bar is CTE's salary-range-composite number. (Ten salary ranges appear on the graphs instead of 11 because so few respondents marked range 11.)
While the composite number means little on its own, in connection with the graph it provides a quick and convenient way of comparing relative salary ranges by position, region, company type and company size.
If you're looking to earn top dollar in the metalworking industry, you're best bet (all things being equal, which they rarely are) is to be a corporate manager at a large general manufacturer in the South Atlantic region.
 | Based on the national average, manual machinists earn the least of all positions, and manual machinists working in the South Atlantic and East South Central regions are paid the least of all, averaging less than the $30,001 to $35,000 range. And possibly because manual machinists in the South Atlantic area are the lowest paid, more money is left over for the region's corporate managers, who earn more than their counterparts in any other region of the country. |
| Key to Graphs | ||||
| Vertical Column | Horizontal Column | |||
| 10 | $90,001-100,000 | MM | Manual Machinist | |
| 9 | $80,001-90,000 | CNC | CNC Machinist | |
| 8 | $70,001-80,000 | P | Programmer | |
| 7 | $60,001-70,000 | TD | Tool & Die Maker | |
| 6 | $50,001-60,000 | TME | Tool/Mfg. Engineer | |
| 5 | $45,001-50,000 | DE | Design Engineer | |
| 4 | $40,001-45,000 | PE | Project Engineer | |
| 3 | $35,001-40,000 | SS | Shop Supervisor | |
| 2 | $30,001-35,000 | ES | Engineering Supervisor | |
| 1 | Less than $30,00 | PM | Plant Management | |
| CM | Corporate Management | |||


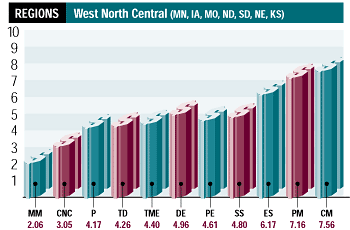
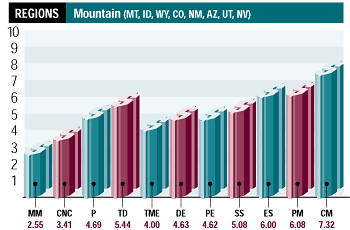
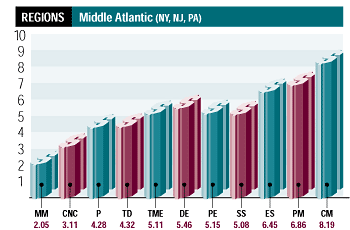
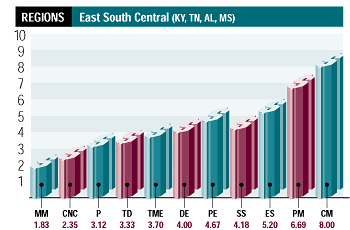
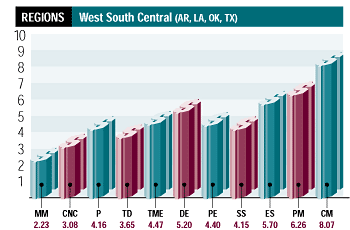
 | While the cost of living may be higher than other areas, workers in the New England region generally make the most, with five positions (tool/manufacturing engineer, project engineer, shop supervisor, engineering supervisor and plant manager) coming out on top compared to those holding similar positions in other parts of the country. |
| Key to Graphs | ||||
| Vertical Column | Horizontal Column | |||
| 10 | $90,001-100,000 | MM | Manual Machinist | |
| 9 | $80,001-90,000 | CNC | CNC Machinist | |
| 8 | $70,001-80,000 | P | Programmer | |
| 7 | $60,001-70,000 | TD | Tool & Die Maker | |
| 6 | $50,001-60,000 | TME | Tool/Mfg. Engineer | |
| 5 | $45,001-50,000 | DE | Design Engineer | |
| 4 | $40,001-45,000 | PE | Project Engineer | |
| 3 | $35,001-40,000 | SS | Shop Supervisor | |
| 2 | $30,001-35,000 | ES | Engineering Supervisor | |
| 1 | Less than $30,00 | PM | Plant Management | |
| CM | Corporate Management | |||
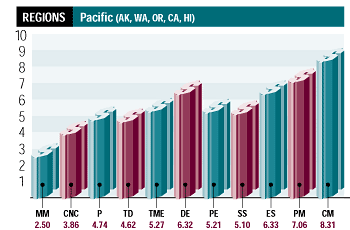
 | The Pacific region pays second best, with four positions (manual machinist, CNC machinist, programmer and design engineer) commanding the top pay range vs. other locales. |
| Key to Graphs | ||||
| Vertical Column | Horizontal Column | |||
| 10 | $90,001-100,000 | MM | Manual Machinist | |
| 9 | $80,001-90,000 | CNC | CNC Machinist | |
| 8 | $70,001-80,000 | P | Programmer | |
| 7 | $60,001-70,000 | TD | Tool & Die Maker | |
| 6 | $50,001-60,000 | TME | Tool/Mfg. Engineer | |
| 5 | $45,001-50,000 | DE | Design Engineer | |
| 4 | $40,001-45,000 | PE | Project Engineer | |
| 3 | $35,001-40,000 | SS | Shop Supervisor | |
| 2 | $30,001-35,000 | ES | Engineering Supervisor | |
| 1 | Less than $30,00 | PM | Plant Management | |
| CM | Corporate Management | |||
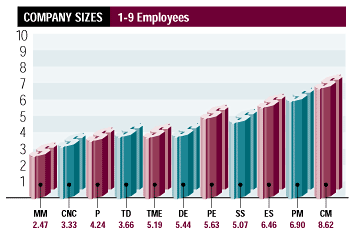
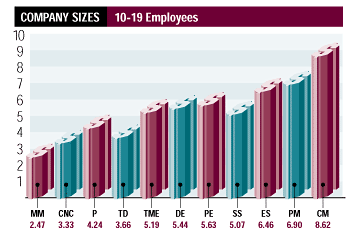
 | When comparing compensation in relation to company size, large companies—those with over 250 employees—pay manual machinists the least while being the most generous when rewarding those involved with managing the corporation. |
 | The key decision makers at companies with fewer than 10 employees take home significantly less than the top brass at larger companies, while their manual machinists' salary range ranks second. Overall, though, workers at companies with one to nine employees tend to earn the least. |
| Key to Graphs | ||||
| Vertical Column | Horizontal Column | |||
| 10 | $90,001-100,000 | MM | Manual Machinist | |
| 9 | $80,001-90,000 | CNC | CNC Machinist | |
| 8 | $70,001-80,000 | P | Programmer | |
| 7 | $60,001-70,000 | TD | Tool & Die Maker | |
| 6 | $50,001-60,000 | TME | Tool/Mfg. Engineer | |
| 5 | $45,001-50,000 | DE | Design Engineer | |
| 4 | $40,001-45,000 | PE | Project Engineer | |
| 3 | $35,001-40,000 | SS | Shop Supervisor | |
| 2 | $30,001-35,000 | ES | Engineering Supervisor | |
| 1 | Less than $30,00 | PM | Plant Management | |
| CM | Corporate Management | |||
 | Comparing salary ranges based on company type shows that mold shops pay four positions (manual machinists, CNC machinists, tool and die makers, and shop supervisors) more than others, but compensate design engineers and plant managers the least. Plant managers at all companies tend to earn between $60,001 and $70,000 annually. |
