


Measuring performance in real time
Real-time measurements during metalcutting can offer significant insight into machine tool performance. The parameters to be measured include position, velocity and acceleration of the axes; cutting force; sound; temperature; and acoustic emission, which is not the same as sound, but rather a high-frequency, structure-borne vibration.
Real-time measurements during metalcutting can offer significant insight into machine tool performance. The parameters to be measured include position, velocity and acceleration of the axes; cutting force; sound; temperature; and acoustic emission, which is not the same as sound, but rather a high-frequency, structure-borne vibration.
These measurements are usually collected with a digital data acquisition system, including a sensor, digital-to-analog converter, computer, storage system and software for manipulating data. To prepare the measurement, the user must specify several parameters, such as the sampling rate, maximum frequency, observation time and frequency resolution. The choice of parameters is important because they are related.
All images courtesy S. Smith
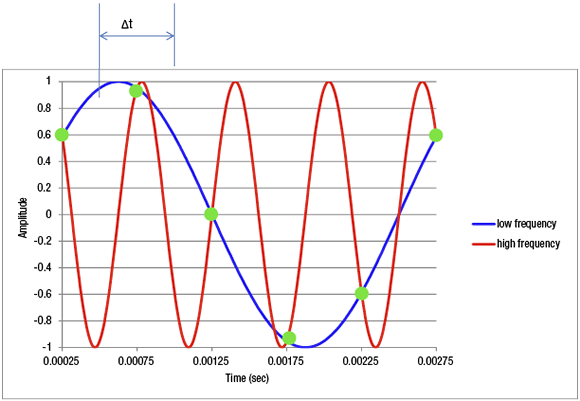
Figure 1. With aliasing, a high-frequency signal (red) looks like a low-frequency signal (blue) because the sampling rate (green) is not fast enough.
Sampling rate: This is the rate of data collection, usually expressed in samples per second. Generally, users prefer slow sampling rates because sampling at a rate of several hundred times per second costs considerably less than a rate of several hundred thousand times per second. Fast sampling rates require more expensive data acquisition equipment and the transmission, storage and manipulation of larger data sets. However, the sampling rate must be fast enough to see the signal of interest. Mathematically, that means there must more than two samples per cycle of the highest frequency being measured.
Table 1. Summary of parameter interactions.
| Selecting this | Sets this | Then choose either |
|
Sampling rate |
Maximum frequency |
Observation time (short means worse frequency resolution, and long means better frequency resolution) or Frequency resolution (small means long observation, and large means short observation time) |
|
Maximum frequency |
Sampling rate |
Observation time or Frequency resolution |
|
Observation time |
Frequency resolution |
Sampling rate (fast means high maximum frequency, and slow means low maximum frequency) or Maximum frequency (high means fast sampling rate, and low means slow sampling rate) |
|
Frequency resolution |
Observation time |
Sampling rate or Maximum frequency |
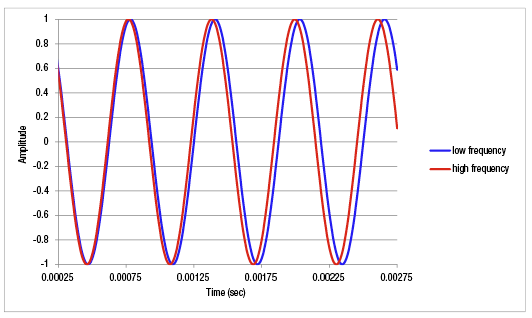
Figure 2. Two signals with similar frequencies become obviously different with longer observation time.
If the sampling rate is too slow, a problem called “aliasing” arises (see Figure 1, page 24). The high-frequency red line indicates the signal to be measured, which, in this case, is a 1,600- Hz sinusoidal signal. The green dots indicate the sampling at 0.005 sec./sample, or 2,000 Hz, a rate that is less than two samples per cycle for the 1,600-Hz signal. A lower frequency (400 Hz) sinusoid passes through all the measured green dots and is shown in blue. After data acquisition, it is no longer possible to determine whether the red or blue signal resulted in the green measurements. The high-frequency signal seems to be a low-frequency signal because the sampling rate is too slow. A similar effect occurs when the shutter on a movie camera samples too slowly to accurately capture, for example, the motion of a rotating helicopter blade.
Maximum frequency: The maximum frequency to be measured may be the tooth passing frequency, the frequency of a sound or a chatter vibration. Users generally like the measurement to include the highest frequencies possible. Once the maximum frequency is selected, it is desirable to use an analog or digital filter to remove higher frequencies from the signal to prevent aliasing. Measuring a 500-Hz signal requires a sampling rate of at least 1,000 samples per second. Even if the user does not know the maximum frequency to be measured, it is important to estimate and remember that a filter removed the higher frequency content from the signal.
Observation time: As the time increases, the number of samples that must be stored and manipulated increases as well. Longer observation times are beneficial, because they allow better frequency resolution, or a finer distinction in measured frequencies.
Figure 2 shows two sinusoidal signals, one with a frequency of 1,600 Hz, and the other with a frequency of 1,630 Hz. At the start of the measurement, the signals look almost the same, but it becomes obvious the frequencies are different as the observation time increases. You may have experienced a similar effect while sitting at a long stop signal, where the turn indicators of two cars seem initially to be synchronized but eventually you realize the blink rates are different because the synchronization is lost. Mathematically, the frequency resolution is 1 divided by observation time. Therefore, measuring for two seconds allows the discrimination of frequencies, which are ½ Hz apart.
Frequency resolution: Choosing the desired frequency resolution sets the time required to make the measurement. Smaller frequency resolution means sampling for a longer time. Table 1 on page 26 summarizes the interaction of data acquisition parameters. These relationships hold for all kinds of measurements. As is common in engineering, the user must make selections that balance conflicting desires and requirements. CTE
About the Author: Dr. Scott Smith is a professor and chair of the Department of Mechanical Engineering at the William States Lee College of Engineering, University of North Carolina at Charlotte, specializing in machine tool structural dynamics. Contact him via e-mail at kssmith@uncc.edu.
Glossary terms in this article
Related
Subscribers can use MFGAxis notes, saves and discussion tools with their innoNET account.