

Bucking the salary trend: Industry Trends & Analysis
CTE's 2024 Biennial Salary and Benefits Survey reveals a drop in pay at most manufacturing positions.
While average weekly earnings among production and nonsupervisory manufacturing workers continued an upward trend over the past 12 months — as reported by the U.S. Bureau of Labor Statistics — Cutting Tool Engineering found a drop in pay for 9 of 11 positions studied by our biennial salary and benefits survey.
BLS reported in June that its preliminary estimate for the average weekly pay among manufacturing workers reached $1,127.71 in May. A year earlier, the average weekly paycheck was at $1,066.51. As helpful as the BLS metric is at helping to gauge the economic health of the industry, the CTE survey parses out average pay for each of the following positions: manual machinist, CNC machinist, programmer, tool and die maker, tooling and manufacturing engineer, design engineer, project engineer, shop supervisor, engineering supervisor, plant manager and corporate manager.
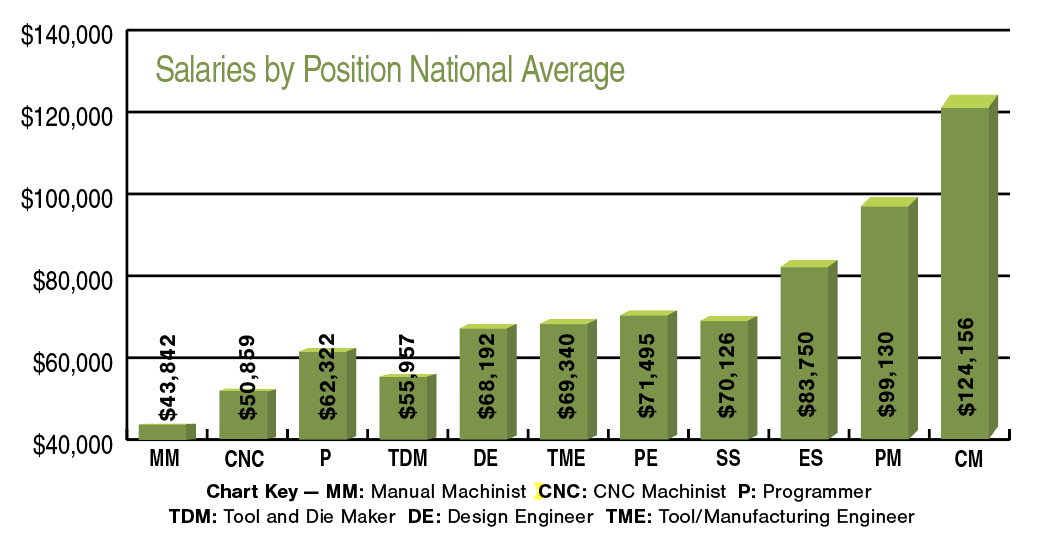
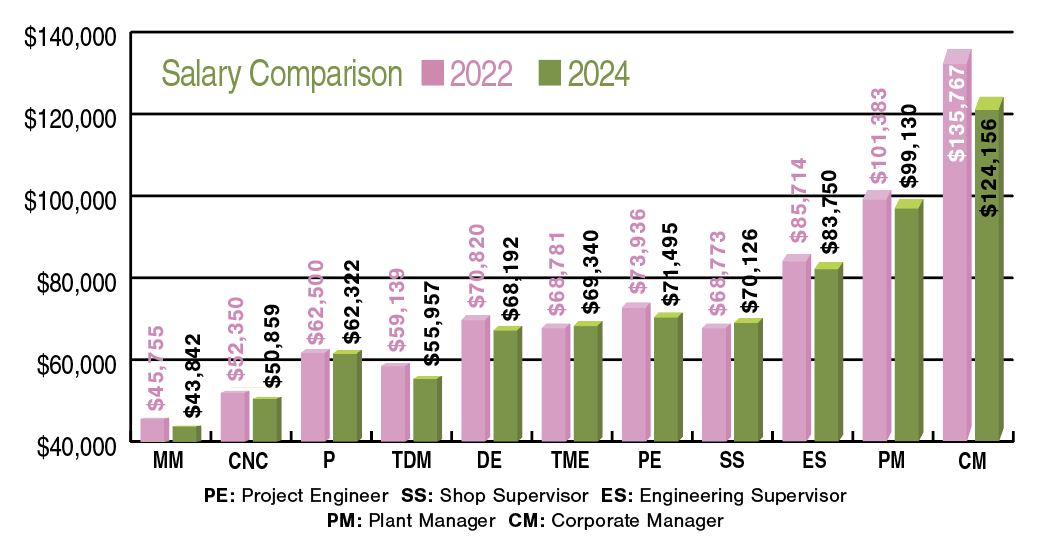
Based on our 2024 survey results, just two positions saw an increase in pay compared to our 2022 survey results — tooling and manufacturing engineers and shop supervisors. Tooling and manufacturing engineers reportedly make $69,340 a year on average nationally, while shop supervisors make $70,126. The salaries represent a 0.8% and 2.0% increase in pay, respectively, since 2022.
The salary and corresponding percentage
decrease in pay since 2022 for the remaining positions follows:
Manual machinist — $43,842, down 4.2%,
CNC machinist — $50,859, down 2.8%,
Programmer — $62,322, down 0.3%,
Tool and die maker — $55,957, down 5.4%,
Design engineer — $68,192, down 3.7%,
Project engineer — $71,495, down 3.3%,
Engineering supervisor — $83,750, down 2.3%,
Plant manager — $99,130, down 2.2%,
Corporate manager — $124,156, down 8.6%.
Our survey results appear to buck the upward trend of manufacturing salaries that’s largely attributed to the ongoing labor shortage. After closer analysis, however, the decrease in salaries is more likely due to several factors. For starters, let’s remember that the COVID-19 pandemic led to a drop in manufacturing salaries across all 11 positions tracked by the 2020 CTE salary and benefits survey. That set the stage for our 2022 survey to show healthy rebound in manufacturing salaries across the board.
Part of that rebound, as we now know, was due in large part to the uptick in manufacturing production during the pandemic. BLS statistics for seasonally adjusted average weekly hours worked among all manufacturing employees supports this conclusion.
By April 2020, according to BLS data, the average number of hours worked among manufacturing employees was 38, a distinct drop from the previous month’s report of 40.3 hours.
The pandemic’s negative impact eased somewhat just a few months later that year when the average number of hours worked each week climbed from 39.7 in July to 40.1 in August. The average number of hours worked per week remained healthy for the next two years, hovering anywhere from a low of 40.1 to a high of 40.6 hours.
Still, BLS data for 2023 reveals a steady decline from a 40.5-hour work week in January to 40.0 hours per week in October of that year. The average hourly work week dropped to 39.9 in November and to 39.8 in December.
The average number of hours worked in January of this year remained at 39.8, then climbed back to 40.0 hours in February and March. Preliminary BLS data for April and May 2024 show a return to a 40.1-hour work week.
Overtime hours worked in manufacturing followed a similar pattern during this time frame, according to BLS, with weekly overtime reaching a high of 3.6 hours in February 2022. Weekly overtime hours then fluctuated between 2.9 and 3.0 from June to September 2023. Weekly overtime hours remained under 3 hours the last three months of that year, and into January 2024. Then, after an uptick to 3.0 hours of weekly overtime recorded in February of this year, overtime dropped back to 2.9 hours in March. From April to May 2024, preliminary BLS data shows that weekly overtime hours went from 2.9 hours to 3.0 hours.
In short, production slowed down.
Certainly this is not the first time manufacturing paychecks have shrunk, as indicated in the historical chart showing CTE survey results from 2002 through 2024.
Another factor impacting the 2024 CTE salary and benefits report is the variation in our survey sample since 2020. Our sampling of companies with 1 to 19 employees went from 26% in 2020, to 22% in 2022 and to 17% in 2024. Respondents from companies with 20 to 99 employees was at 21% in 2020 and at 30% in both 2022 and 2024. And companies with 100 or more employees made up 53% of our sample in 2020, 48% in 2022 and 53% in 2024.
Review the print ads from this magazine to continue
This quick advertiser review unlocks the rest of the article and keeps the full-screen reader focused on the ads instead of the page chrome.
Advertisers included in this article experience
Print placements connected to this article
Lyndexnikken
Achieve Exceptional Results
and Gain a Competitive Edge With High-Performance Solutions for Turning Centers Maximize the potential of your turning operations with high-performance turning center accessories and automation. Engineered for exceptional results, our solutions significantly enhance your accuracy, efficiency, and productivity – driving significant improvements to your bottom line
Achieve Exceptional Results and Gain a Competitive Edge With High-Performance Solutions for Turning Centers Maximize the potential of your turning operations with high-performance turning center accessories and automation. Engineered for exceptional results, our solutions significantly enhance your accuracy, efficiency, and productivity – driving significant improvements to your bottom line. By partnering with Lyndex-Nikken, you can achieve high-performance results and gain a competitive edge in the market. Lyndex-Nikken is your partner in growth. SCAN TO LEARN MORE
Visit Lyndexnikken View this placement in the issue recordPrint ads from this magazine
and Gain a Competitive Edge With High-Performance Solutions for Turning Centers Maximize the potential of your turning operations with high-performance turning center accessories and automation. Engineered for exceptional results, our solutions significantly enhance your accuracy, efficiency, and productivity – driving significant improvements to your bottom line
Achieve Exceptional Results and Gain a Competitive Edge With High-Performance Solutions for Turning Centers Maximize the potential of your turning operations with high-performance turning center accessories and automation. Engineered for exceptional results, our solutions significantly enhance your accuracy, efficiency, and productivity – driving significant improvements to your bottom line. By partnering with Lyndex-Nikken, you can achieve high-performance results and gain a competitive edge in the market. Lyndex-Nikken is your partner in growth. SCAN TO LEARN MORE
Continue reading
August 2024
Interestingly, eight of the 11 positions we track indicated a pay increase in 2024 for workers at companies with 1 to 19 employees. Of this group, only tool and die makers, engineering supervisors and plant managers earned less in 2024.
To help put our 2024 survey results in more perspective, CTE also presents the salary for each position based on region, industries served and each company’s primary business type (machine shop, metalworking supplier, general manufacturer, or tool, mold and die shop).
For example, those of you working for a company in the Midwest likely have not noticed a drop in pay because your salaries were up across all positions. That’s significant because we had enough respondents in the Midwest to generate salary results with a 95% confidence level for each position.
While the West region (see Table ??) indicates higher salaries than in the Midwest in some instances, we did not receive enough respondents in the West region to provide a statistically valid result. Nevertheless, the accompanying tables indicate the results we were able to derive.
That said, we can report with a 95% confidence level that companies serving the defense industry paid employees salaries that beat the national average at each position in 2024. Aerospace was second on the list for most lucrative paychecks by industries served. Third was the heavy equipment industry.
Benefits offered
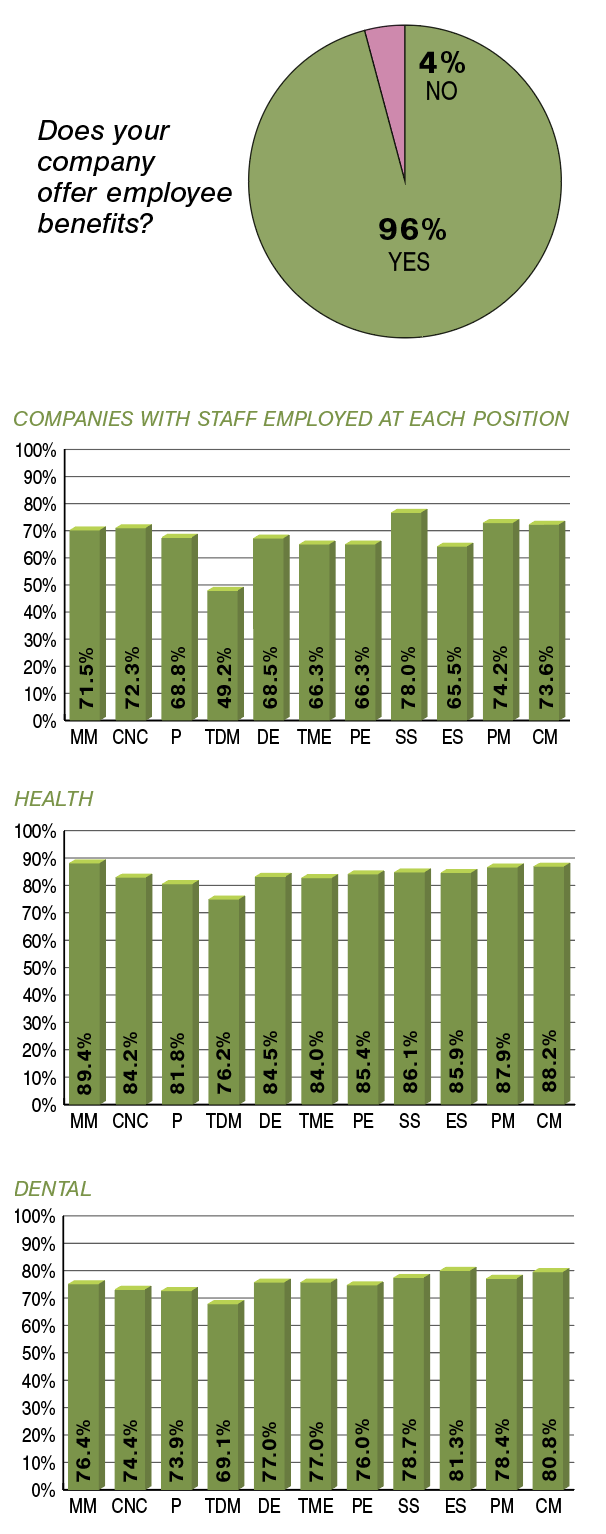
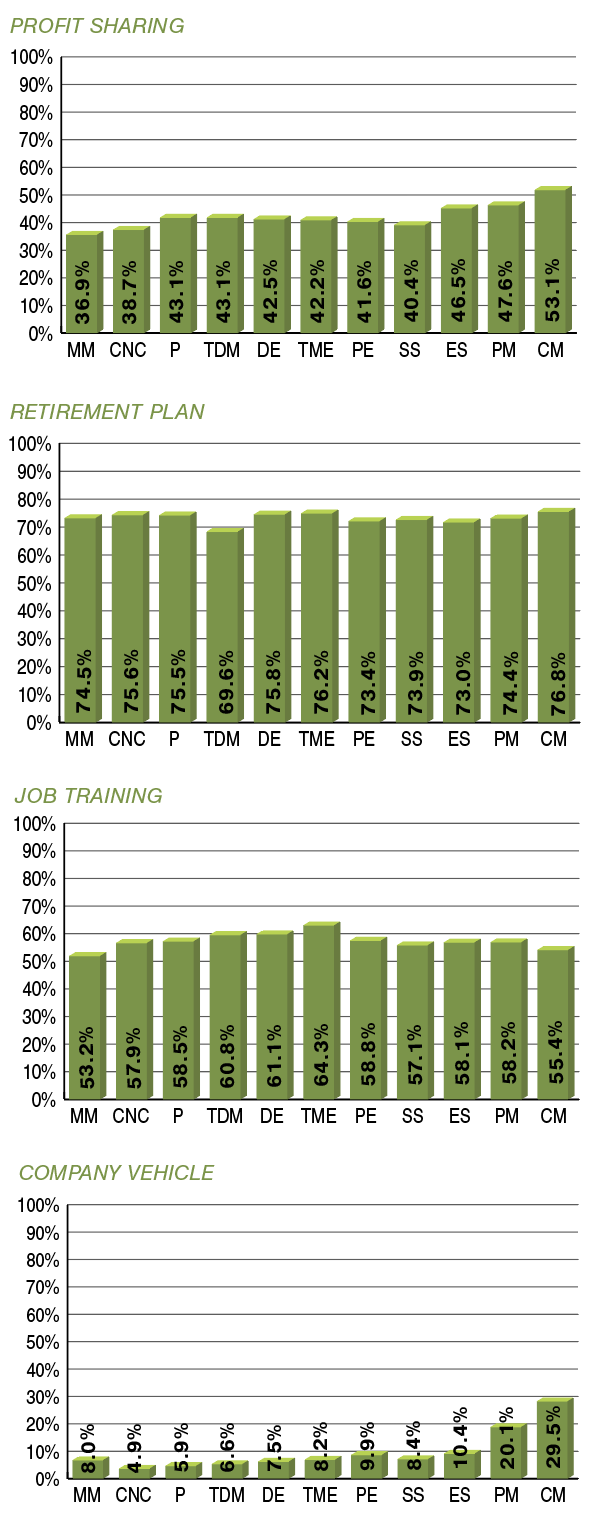
As usual, our biennial survey also provides a snapshot of what benefits are offered to manufacturing workers at each position. Among the respondents, 96% said they provide benefits of some type to their employees — a result that has not fluctuated much in the past several biennial surveys.
That said, this year CTE has changed the way we calculate the percentage of companies offering a particular benefit at each position. In the past, this percentage was calculated by dividing the total number of companies that offer, for example, job training to CNC machinists by the total number of companies responding to the overall benefits question.
Instead of dividing by the total number of companies that respond to the benefits portion of the survey, CTE now calculates the percentage of companies offering, again for example, job training to CNC machinists by the total number of companies that employ CNC machinists.
While this approach doesn’t mean companies are suddenly offering more benefits to more employees than 2 years ago, it should reflect a truer picture when you compare one position to another.
For instance, just 37.1% of companies reported offering a health plan to tool and die makers in 2022. That’s quite a bit below the percentage offering a health plan to each of the other positions.
By taking into account that not all of the companies employ a tool and die maker, CTE can report this year that 76.2% of the companies that employee tool and die makers offer a health plan to them.
By the way, 49.2% of all the responding companies indicated that they employ tool and die makers. For more on the makeup of our 2024 survey sample, see “About Our Respondents” below. For more about how we conducted this year’s survey, see “Survey Methodology.”
About Our Respondents
Here’s who responded to Cutting Tool Engineering’s 2024 biennial salary and benefits survey:
A total of 377 respondents from manufacturing companies nationwide.
- 65 companies with 1 to 19 employees.
- 113 companies with 20 to 99 employees.
- 199 companies with 100 or more employees.
- 30 metalworking suppliers.
- 39 tool, mold and die shops.
- 89 machine/job shops.
- 219 general manufacturers.
- 141 companies located in the Midwest region.
- 119 companies located in the East region.
- 72 companies located in the South region.
- 26 companies located in the West region.
- 19 companies located in the Mountain region.
CTE also added a new question to the survey this year, asking respondents to indicate which industries their companies serve: aerospace, automotive, communications (computers/electronics), defense, dental, energy, heavy equipment, Marine (ship, boat, barge, etc.), medical, railroad and other. See the accompanying bar chart for the percentage of companies that indicated they serve these industries.
Survey Methodology
Cutting Tool Engineering’s 2024 biennial salary and benefits survey was conducted from April through July using the online SurveyMonkey service. As in 2020 and 2022, the 2024 survey uses data collected from two sources — our own subscriber base and a manufacturing survey panel available through SurveyMonkey.
While the survey originally obtained 417 total responses (214 from our CTE audience and 203 from SurveyMonkey panels), a total of 40 responses were deleted due to being incomplete or outside the metalworking industry. The total number of valid respondents was 377.
CTE created a web-based survey instrument using SurveyMonkey and then emailed the link to members of our subscriber audience who have access to companywide salary information.
In addition, CTE again utilized a paid data collection option whereby SurveyMonkey obtained responses to our survey using its own survey panels that target the manufacturing industry. When CTE first utilized this SurveyMonkey service in 2020, we sought to ensure that the difference in respondents by company types did not significantly impact salary results. So CTE weighted 2020’s sample to match the company type proportions from 2018’s survey. When we compared the average salaries across the unweighted and weighted samples, no meaningful differences were found.
Average salaries for each position were calculated according to the arithmetic mean. Using the CNC machinist position as an example, CTE asked respondents to “indicate the approximate annual salary for CNC machinists at your company.” Respondents were given a series of 25 or so salary options from which to select an answer (such as $40,000, 42,500, $45,000, etc.) For this year’s survey, 302 companies responded to the salary questions, with 75 respondents skipping this section. To calculate the national average salary for CNC machinists, CTE would total all the salaries together and divide that sum by the total number of companies employing a CNC machinist, which in this case was 227 because 75 respondents indicated they don’t employ a CNC machinist. So the national average salary for a CNC machinist this year is $50,859 ($11,545,000 ÷ 227).
Benefit percentages were calculated by dividing the total number of positive replies to a benefit offered for each position by the total number of companies employing someone in each respective position. As an example, CTE had a total of 340 companies respond to the benefits question this year (with 37 skipping the question). CTE then asked respondents to indicate by position which of the following benefits they offer: health plan, dental plan, profit sharing, retirement plan, job training, and company vehicle. We also asked respondents to select not applicable “for positions that don’t exist at your company.”
Of 340 respondents to our benefits question, 74 indicated that they do not employ a CNC machinist at their company. So if 224 of these respondents indicated that they offer company-paid health insurance to CNC machinists, CTE would determine the percentage of companies offering health insurance to CNC machinists by dividing 224 by the total number of companies that employ a CNC machinist (340 – 74 = 266). So, in this case, the percentage of CNC machinists receiving that benefit would be 84.2% (224 ÷ 266 = 0.842).
Related


Subscribers can use MFGAxis notes, saves and discussion tools with their innoNET account.