


Experimental machining
Using the design of experiments process for QC on the shop floor.
View print ads from this spread
Review the ads on this magazine spread to continue reading. Each ad takes two seconds; a two-page ad counts once.
Advertisers on this magazine spread
Print placements on this magazine spread
Abrasive Tech
Aces.
Play your cards right. The stakes are higher than ever in today's business environment. Fortunately, the experts at Abrasive Technology can keep you from getting lost in the shuffle. Call or visit the web address below for more information about our finely crafted superabrasive products. With Abrasive Technology, you'll feel like the deck is stacked in your favor
Aces. Play your cards right. The stakes are higher than ever in today's business environment. Fortunately, the experts at Abrasive Technology can keep you from getting lost in the shuffle. Call or visit the web address below for more information about our finely crafted superabrasive products. With Abrasive Technology, you'll feel like the deck is stacked in your favor. GRIND SHARPEN POLISH DRILL IS #1 www.abrasive-tech.com/aces 800.964.8324
Visit Abrasive Tech View this placement in the issue recordPrint ads from this magazine
Play your cards right. The stakes are higher than ever in today's business environment. Fortunately, the experts at Abrasive Technology can keep you from getting lost in the shuffle. Call or visit the web address below for more information about our finely crafted superabrasive products. With Abrasive Technology, you'll feel like the deck is stacked in your favor
Aces. Play your cards right. The stakes are higher than ever in today's business environment. Fortunately, the experts at Abrasive Technology can keep you from getting lost in the shuffle. Call or visit the web address below for more information about our finely crafted superabrasive products. With Abrasive Technology, you'll feel like the deck is stacked in your favor. GRIND SHARPEN POLISH DRILL IS #1 www.abrasive-tech.com/aces 800.964.8324
Continue reading
June 2010
Using the design of experiments process for QC on the shop floor.
Experimentation has always been a part of machining. For example, most shops regularly experiment to achieve one of the following outcomes: optimize a process to save money; prevent a problem, such as warping, out of roundness, poor surface finish or short tool life; precisely define how some variables impact part production by developing an equation or a graph to show exactly what the relationship is; or establish the repeatability of using the same machining setting to find the standard deviation of a process.
The simplest testing method is to consider the variables to be studied, decide what to measure and how and then change one variable at a time when machining parts. This approach works, but it is more expensive and reveals less information than an approach called statistical design of experiments, a tool for enhancing quality. DOE also requires fewer samples to obtain more information and can determine the relationship between the different factors affecting a process and the output of that process. For simple DOEs, the math involved is addition, multiplication and division. For large studies, DOE software is available.
DOE is the design of any information-gathering exercise where measurable data is present, including cutting force, tool life, surface finish, workpiece material, coolant, process cost, cycle time, queue time and parts per hour. It is suitable for molded part production, chemical reactions, flight tests, engine life, air pollution, cattle weight gain, crop yield—anything that provides a quantitative number.
Deburring Example
For an example of how DOE works, let’s consider a process many have some experience with but typically no data: brushing burrs off small parts without changing part dimensions or surface finish. There are at least a couple dozen different types of brushes and buffs, but, initially, let’s study 500-grit aluminum-oxide and 600-grit silicon-carbide nylon brushes to obtain some preliminary data.
The end user suspects that the brush type, number of brush passes along the edge of a 303 Se stainless steel part and feed rate are important. However, if he has never collected such data, he doesn’t know which of these variables are truly significant. The objective of the tests is to find conditions that will remove the burrs while not generating an edge radius larger than 0.003 “. The burrs left after grinding these miniature parts are typically less than 0.001 ” thick.
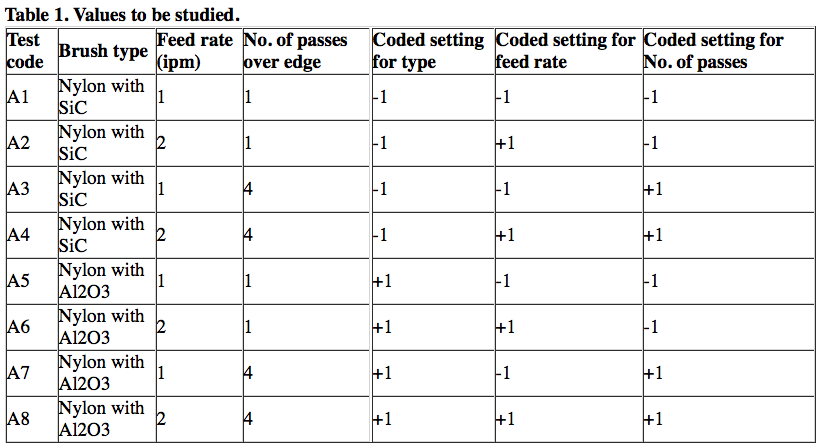
Table 1 shows the actual settings used and the coded settings to simplify the discussion. A -1 setting indicates the lowest value studied and +1 indicates the highest value. Note that there are three variables at two levels, or values, which provides 23 test points, equaling eight tests. These eight test points can be viewed as corners of a cube. Looking at three values of four variables would require 34, or 81, tests, but it is possible to reduce that number with some statistical-based assumptions.
DOE does not care what values are picked to study. The feed rates could be 0.435 and 17.6 if those made sense. The data would still use -1 or +1 to represent the highest or lowest values because those values are easier to follow.
Sequence Randomization
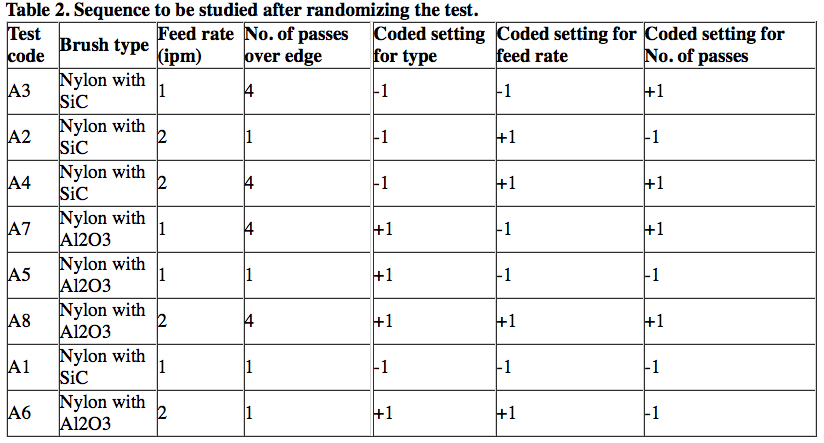
It is important to randomize the test sequence. To do that, consult a math book that has a table of random numbers, use sequence randomization software or simply roll dice to randomly generate a set of numbers from one to eight. If running three samples at each setting instead of one sample, generate random numbers from one to 24. The test will be run in the top-to-bottom sequence shown in Table 2.
Failure to randomize the tests allows other factors to influence the values and conclusions generated. Even when a test designer prepares such a table, shop personnel will often independently decide that it makes sense and saves time to change just one variable at a time. They often do this without telling the team leader. That is why it’s important that the leader is in the shop when these tests are run to ensure the proper testing sequence is followed.
Courtesy of Credit for all: L. Gillespie
Figure 1. Map of the average radius produced by the 600-grit, silicon-carbide and 500-grit, aluminum-oxide brushes.
The part edges are measured three times to determine the average radius. That tells how much variation exists within an edge, which is important when specific pass/fail values are required. Table 3 provides the measured responses. If desired, additional measurements could be taken, such as surface finish, contamination from the brush, time to clean the parts after brushing and the cost of brushing. That would not require additional samples, just further inspection of existing samples.
An analysis of the data in Table 3 is shown in Table 4. Limited space prevents describing the math behind how these numbers were obtained, but the math and definition of the terms presented are described in books about DOE. Suffice it to say that analysis of variance is the terminology of the analysis, and the test design is a factorial experiment.
Data Results
The data indicates there is little performance difference, on average, between the two brushes because the F value is relatively low, at 3.41. Clearly, the feed rate impacts the results because the F value is 30.10 (a number above 4.49 for this test indicates the impact is statistically significant, having a 95 percent probability).
Surprisingly, this test indicates the number of passes was not significant by itself. One brush had unusual performance at one feed rate as indicated by the 8.51 F value for the brush-feed interaction. The table data does not indicate what the impact is, but DOE software will provide that.
There was a significant result—a 26.13 F value—for one combination of brush and passes, and the combination of feed rate and number of passes had an even more significant impact at 42.30. The significance here is that high F values signal that something important resulted.
Figure 1 illustrates the radii when the results of the two brushes are averaged together. Because the feed rate line is horizontal at the one-pass setting, there is no impact for the feed at that setting. In contrast, because the feed line is not horizontal at four passes, a slower feed and multiple passes would generate a larger radius. That makes sense because the brush contacts the edge longer. Because the radii must be smaller than 0.003 “, this graph shows no combination of variables will provide that small a radius based on the average of both brushes.
Figure 2 plots the same variables as Figure 1 but only shows the results for the SiC-filled nylon brush. Applying this brush at a fast feed rate for one pass generates a radius at or near the 0.003 ” maximum. This was determined by looking at the brush-feed-passes interaction. Additional analysis not shown here indicates that the radii generated are more consistent at each setting using the SiC brush than those for the Al2O3 brush.
Figure 2. Map of the average radius produced by 600-grit, silicon-carbide abrasive in a nylon fiber brush.
Figure 3. Map of the average radius produced by 500-grit, aluminum-oxide abrasive in a nylon fiber brush.
Figure 3 plots the same variables for just the Al2O3-filled nylon brush. For some unexplainable reason, the only way to get the smallest radius is to feed fast and take more passes. That does not make sense because more passes at a high feed should remove more material, but it is what the data indicates. Perhaps, the person performing the test made an error, or, perhaps, the effect is real.
Because the SiC brush performed consistently, and a fast feed and few passes result in burr-free, low-radii edges, the user should take one pass at a 2-ipm feed using the SiC brush or conduct another experiment at a faster feed. At a faster feed, however, there’s a risk of not removing all the burrs.
What DOE Shows
So what did DOE produce that was not apparent from traditional tests? First, with DOE software, a user can generate various graphs to better visualize how the variables interacted. Some software quickly provides 20 to 30 different graph styles and, with three or four variables, that amounts to more than 100 different ways to understand the data.
Second, DOE shows how one variable or factor affects another. For example, choosing the highest value of passes with the lowest feed value gets a bigger effect than any other combination. Users can immediately tell which value—high or low—provides the optimal settings and which direction to go to further improve. To do this using a trial-and-error approach can take hundreds of trials, not just eight.
Third, because of the way DOE tests are structured, an estimate of the standard deviation is possible even without taking more than one sample at each setting. That allows categorically stating that some apparent improvements are or are not statistically significant. If it is not statistically significant, it is random rather than repeatable. That is important for convincing others of the results and preventing the need for future experiments.
Fourth, randomizing the tests eliminates much of bias that occurs from tool wear, operator fatigue, machine warm up, etc.
Lastly, with two values for each variable, a user obtains 50 percent more information than changing one variable at a time. When there are several variables and three levels, DOE allows users to discard up to a third of the normally needed tests without losing much insight. DOE software also provides equations for the results. It includes the impact of all the variables, unlike one-at-a-time tests.
Users do not need a statistics background to use DOE formats. Purists will insist otherwise to insure the validity of results, but shops are generally interested in simple, quick ways to improve and DOE provides that. For high-cost studies, consider every issue. Most universities have DOE experts and offer DOE courses. Look for courses focused on application rather than the underlying theory. In addition, DOE books by Charles Hicks and Douglas Montgomery cover both theory and practice and are relatively easy to follow.
There are many variations beyond the simple approach described here. Nonetheless, if you need quantitative answers to convince a customer or your staff, use statistical design of experiments. CTE
About the Author: Dr. LaRoux K. Gillespie has a 40-year history with precision part production as an engineer and manager. He used statistical design of experiments extensively in his research and application of deburring and precision machining. He can be e-mailed at laroux1@earthlink.com.
Software offers solutions for DOE testing
While users can manually perform the calculations for simple statistical design of experiments with two levels and two variables, software programs specifically developed for DOE simplify analysis and graphing. DOE programs include Design-Ease and Design-Expert from Stat-Ease Inc., Minneapolis; QI Macros statistical process control software for Excel from KnowWare International Inc., Denver; JMP statistical discovery software from SAS, Cary, N.C.; DOE++ from ReliaSoft Corp., Tucson, Ariz.; and Minitab from Minitab Inc., State College, Pa., which was used to display the article’s brushing results. Most of these have free downloadable versions good for 30 days.
Most users will want to work with a person familiar with DOE and the software on at least one experiment before venturing out on their own because the tutorial jargon is oriented to people familiar with statistics. Once through the process, it’s easier to repeat the process for other combinations—even those with three or more levels and five or six variables. After a user answers some simple questions, Minitab, for example, immediately yields a fully structured experiment in which the user inputs the data results.
A first-time user should look for DOE software that has an intuitive and easy-to-use interface, comes with well-written manuals and tutorials, randomizes the order of experimental runs and provides a variety of graphical outputs, including 3-D.
—L. Gillespie
Table 3. Results for brush deburring grinding burrs in 303 Se Stainless Steel.
Table 4. Analysis of variance for the data in Table 3 using radii expressed in thousandths of an inch (i.e., 6.5 rather than 0.0065).
Source = variable combination studied; DF = degrees of freedom; SS = sum of squares; MS = mean square; F = F distribution value. *Statistically significant at the 95 percentile level.
Glossary terms in this article
Related
Subscribers can use MFGAxis notes, saves and discussion tools with their innoNET account.