Squared Straight
Squared Straight
Three different problems can cause a laser to make beveled cuts. As these problems interact, they create distinct patterns of bevel angles that require sophisticated mathematical analysis to sort out. This article discusses an experiment using Fourier analysis to determine which combination of problems caused the cyclical variation that was observed in the measurements of a laser's cutting angle.
A well-adjusted laser cutting system should produce parts with square edges. But until now, it has been difficult for users or laser-system builders to know how to make the necessary adjustments. Machines that are out of adjustment produce seemingly random bevel-angle variations of up to several degrees around the periphery of each part. Often, several causes combine to produce the bevel variation, and it usually is not obvious what corrections are necessary for the machine to produce square edges.
A simple way to test for square edges is to laser cut a round part 1.00" to 2.00" in diameter and 0.15" to 0.25" thick. Stand the part on its edge on a flat, level surface and roll it. If it wobbles from side to side or falls over, the system needs to be tuned.
Three Causes
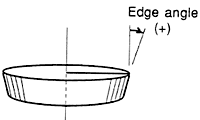
Figure 1a: An incorrectly focused laser beam will produce an edge with a constant bevel. A circular cut with this beam will produce a conical part.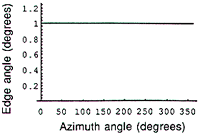
Figure 1b: A constant bevel angle plotted over the azimuth angle yields a straight, horizontal line.
Three separate causes of bevel effects keep laser cutters from producing square edges. Each creates a distinctive pattern of edge-angle variation around a circular part. If an incorrectly focused laser beam is used to cut the circular part, it will create a conical part, with a kerf tapered by the same amount all the way around the part's circumference. If the focus is set too high, the conical part will have the larger diameter on top (Figure 1a). If the focus is set too low, the larger diameter will be on the bottom. Beam power, cutting speed, focus-spot diameter, gas-jet height, pressure, and nozzle design also can affect the cut-kerf taper as they interact with the focus setting.
By the convention adopted here, an ideal edge—that is, one that is perpendicular to the plane of the workpiece—is said to have an angle of 0°. A positive edge angle means the circular part decreases in diameter from top to bottom. If the diameter increases, the edge angle is negative.
When the edge angle of a conical part is plotted as a function of the azimuth angle (the angular position around the part stated in degrees from a starting point), it appears as a horizontal line, showing that the bevel angle is constant as a function of the azimuth angle (Figure 1b).
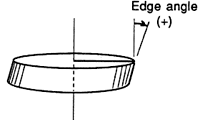
Figure 2a: The edge angle of a part cut with a tilted beam changes continuously around the part.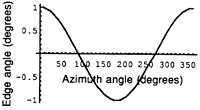
Figure 2b: One cycle of bevel variation created by a tilted beam is represented by the sinusoidal variation with respect to azimuth angle.
A beam that is properly focused but not perpendicular to the work surface will create a tilted cut-kerf. In this second effect, the bevel angle made by a tilted beam will change as the cutting direction changes. Cuts made along a line that is parallel to the direction of the tilt will be square with the part's surface and cuts made along a line at 90° to the direction of the tilt will have the steepest angle. Reversing the cut direction along any given line will not affect the bevel angle. Figure 2a shows the shape of a part that would result from a circular cut made with a tilted beam. Plotted against azimuth angle, the cut-kerf angle is seen to vary sinusoidally around the part (Figure 2b).
Beam tilt may not be the only reason for this pattern of edge-angle variation, however. For example, if the focused beam is not well-centered in the gas jet, the offset could cause a single cycle of variation that would look the same.
Tilt, by itself, would be relatively easy to correct. A user or machine builder could measure the bevel angle at a few places around a part cut with a tilted beam, plot a sine function through the points, and, by calculating the amplitude and phase angle of the cyclic variation, directly determine the magnitude and direction of the tilt. Using this information, a technician could readjust the machine to eliminate the inclination.
Tilt is rarely the only cause of edge-beveling, however, and the pattern of bevel angles will seldom be so easy to analyze. The pattern of angle variations could be complicated by the effect of noncircular beam polarization, which is a third cause of bevel-angle variation.
When a beam is polarized linearly or elliptically, optical absorption on the semicircular surface at the leading edge of the cut will depend on the direction the beam is traveling in the cut. This optical absorption determines the bevel angle cut by the beam. Because a change in the beam's direction affects absorption, it will also affect the bevel angle. A noncircular polarized beam will cut the steepest when it is traveling along any line that is at ±45° to the polarization direction. The direction of the beam's tilt will depend on the direction that the beam is moving along this line. In one direction, the beam will undercut the part; in the reverse direction it will overcut.
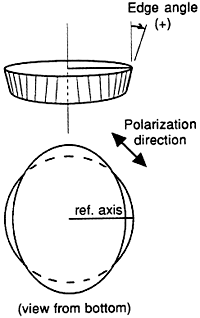
Figure 3a: A linearly polarized beam produces a part with two cycles of edge-angle variation around the periphery.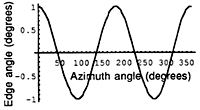
Figure 3b: This plot of edge-bevel angle vs. azimuth angle shows the variations caused by a polarized beam.
Figure 3a shows how a circular part cut with a linearly polarized beam would look. Figure 3b shows a plot of the two cycles of bevel-angle variation that would be observed around the edge of the part. It is worth noting that if the workpiece material is thick enough and the bevel angle is large enough, such a part would be trapped in the plate from which it is cut.
In principle, the three causes for beveled edges are independent of each other. Any combination of the causes may be at the root of a squareness problem. In combination, these causes can produce significant bevel angles and rich, often bewildering, patterns of variation that can easily frustrate anyone attempting to improve this aspect of part quality.
A New Solution
Recently, my associates and I at M*Squared Co., Los Altos, CA, developed a technique and an instrument for detecting, analyzing, and eliminating the causes of edge bevel. At the heart of this technique is a mathematical procedure called Fourier analysis, which allows the separate causes of bevel variation to be individually measured. Technicians can use the results of this analysis to guide them as they adjust the individual laser-system parameters associated with each bevel effect to bring edge squareness to near perfection.
For the analysis to work properly, the number of locations around the part where bevel measurements are taken must be greater than twice the highest number of cycles expected. To adequately detect the two cycles of angle variation caused by beam-polarization problems, at least five equally spaced bevel measurements would be needed. In developing our technique, we chose to make eight measurements to gain a more robust determination of the effects. By making the measurements around an octagonal part, the 45° sample intervals can be accurately set by the laser CNC system. In contrast with a circular part, an octagonal part provides flat faces along which several bevel-angle measurements can be made, if necessary.
Testing the Theory
We tested our technique by analyzing samples cut on many laser systems. One of our assumptions as we designed our analysis technique and measuring equipment was that there are no significant effects that cause more than two cycles of bevel variation around the periphery of a laser-cut part. Our experiments were designed to test this assumption.
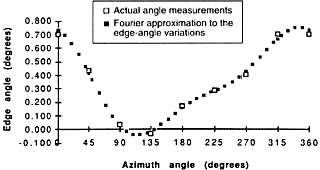
Figure 4: The open squares on the plot of edge-bevel angle vs. azimuth represent the actual measured values. The solid squares represent data derived from a Fourier-series approximation to the experimental data.
Figure 4 is an edge-angle plot from one of the experimental octagons. The open squares are the actual measurements from the part. The solid squares are the Fourier approximation to the edge-angle variations. To generate the approximation, only the terms that represent the taper, tilt, and polarization effects were used. If the edge-angle deviations had been influenced by some other unforeseen effect that produces more than two cycles of variation around the part, the plot of actual measurements would not follow the Fourier approximation. But as Figure 4 shows, the approximate function is a close fit to the data. The data in Table 1 corroborate this conclusion. The small amplitude of the third harmonic listed on this table suggests that all differences between the data and the approximation were caused by random deviations.
| |||||||||||||||||||||||||||||||||||||||
Table 1: Edge-bevel data for octagonal test cut
We also wanted to determine if changes in the setup of the laser system would change the amplitude and phase angle of an edge-angle cycle in predictable ways. For example, our theory suggests that an adjustment of the focus height would change the cut-kerf taper but not the other components of an edge-angle's variation pattern. Similarly, changing the incidence angle of the focused beam should produce an equal change in the amplitude of the first harmonic. Also, the phase-angle information gleaned from an analysis of edge-angle deviations should provide the information needed to determine which direction the beam should be moved to correct a tilting problem.
We chose to test what effect a change in a beam's incidence angle would have on edge-angle variation. Two octagons were laser cut. Before the second octagon was cut, we tilted the beam-bending mirror above the final lens to change the incidence angle of the focused beam. According to our calculations, the mirror adjustment should have resulted in a -2.1° change in the beam's pointing angle.
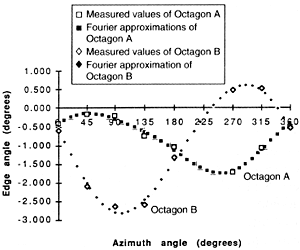
Figure 5: When the plots of edge-bevel angles of two laser-cut octagons are compared, the results of changes to the beam tilt can be seen.
Figure 5 shows plots of two octagons. Octagon A was cut without angle adjustment. The measured edge angles of the two samples are shown as open symbols, and the Fourier approximation functions are shown as solid symbols. The plots show that the angle change had the expected effect. The change only influenced the bevel in one direction of beam travel. No change in bevel angle is seen on the edges that correspond to 0° and 180° azimuth angles. But when the edges that correspond to the 90° and 270° azimuth locations on the two octagons are compared, the difference in their bevel angles is seen to average -2.3°, which is nearly what our calculations said the difference should be.
The Fourier approximation also provides a way to determine the change in tilt angle. The Y component of tilt for octagon A is 0.69°. For octagon B the result is -1.66°. The difference of -2.35° is, again, close to the expected result.
Real-World Uses
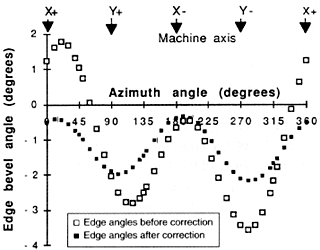
Figure 6: These plots of edge-bevel angles represent the edges of octagons made before and after the laser system was tuned. The open squares, which show a wider variation, represent the part that was made before tuning.
Diagnostic techniques using Fourier analysis have been used to guide the tuning of several laser cutting systems. Such adjustments might be made by the machine's builder before shipping the unit or by a user after changing a lens or performing other routine maintenance. Figure 6 shows the progress made in bringing one machine's beam back into alignment. Edge-angle variations that occurred before any adjustments were made are shown by the open squares on the plot. The part's edge angles varied by 5.3°. Because a large part of this variation was caused by the beam's polarization, we changed the quarter-wave phase retarder in the system and then adjusted the focus height to reduce the cut-kerf taper. Although this reduced the range of variation to 1.86°, it did not solve the problem completely. Further refinements would require finding the right combination of factors to reduce the taper. If the taper were reduced to 0°, the remaining variation, due mainly to elliptical beam polarization, would be less than ±1½.
It is interesting to note that, in principle, the same techniques used to correct edge bevelling could be used to produce a desired pattern of edge-bevel variation. The factors that produce predictable patterns of bevelling could be set according to calculations made using Fourier analysis, and the laser would then produce the desired geometry.
About the Author
Mike Sasnett is president of M*Squared Co., Los Altos, CA.


