Measuring asset performance
Measuring asset performance
In today's hypercompetitive, globalized economy, businesses are pressured to do more, do it faster, do it right the first time and do it all with fewer resources. The Internet of Things and Industry 4.0 have given birth to asset-monitoring software that should enhance competitiveness in this environment, but it can also be like turning on a waterfall of data that raises the risk of "task overload." Faced with task overload, most people focus on what they think is most important while a seemingly peripheral task is temporarily ignored.
In today's hypercompetitive, globalized economy, businesses are pressured to do more, do it faster, do it right the first time and do it all with fewer resources.
The Internet of Things and Industry 4.0 have given birth to asset-monitoring software that should enhance competitiveness in this environment, but it can also be like turning on a waterfall of data that raises the risk of "task overload." Faced with task overload, most people focus on what they think is most important while a seemingly peripheral task is temporarily ignored.

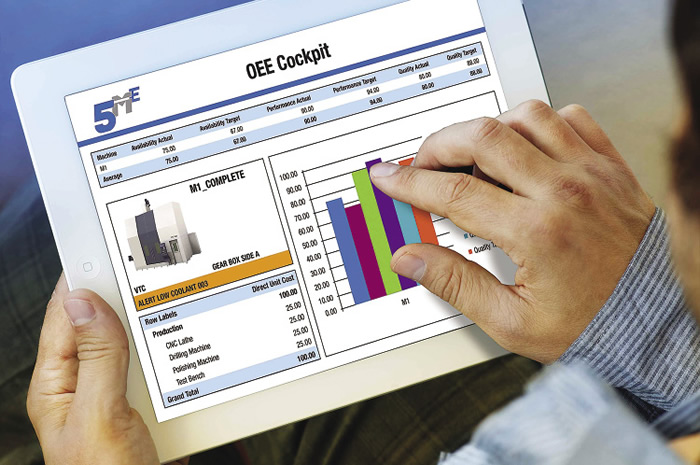
Freedom eLOG asset-monitoring software from 5ME can be accessed anytime via a tablet, as well as a smartphone. Image courtesy 5ME.

Likewise, the volume of data available in a manufacturing plant from asset-monitoring software can overwhelm management's ability to prioritize on areas for improvement and monetize the value of the changes. Freedom eLOG asset-monitoring software from 5ME addresses this issue using breakouts of machine status designated by AMT – The Association For Manufacturing Technology.
This micro- and macro-cataloging of information can serve multiple departments. Details as fine as the run time for specific cutting tools are accessible for shop floor managers to ferret out the causes of delays, while trend graphs keep senior executives informed about overall equipment efficiency and bottom-line numbers that show red or black ink on plant assets.
The software's e$CORE feature generates a monetized version of machine tool performance based on the six span-time categories defined by AMT (plant shutdown, scheduled downtime, delay time, repair time, not in-cycle process time and in-cycle process time). The feature clearly shows manufacturing gains or losses in dollars, putting the amount being saved or wasted at management's fingertips. Previously, these gains or losses—and their causes—were measured in frequency or duration. By attaching dollar amounts, it's easy to see which operational changes would give the most bang for the buck.
e$CORE includes three types of reports: burden, monetary and summary. Users can customize the reports based on an assigned hourly value for each machine. Users assign percentage "weights" based on the AMT category, and the e$CORE value is calculated by summing the daily values in each category.
The three report types can be viewed in monthly, weekly, daily or hourly timeframes. The burden report compares the performance of selected machines and presents a net value in a stacked bar graph. Each bar shows how a category
contributed to the cumulative e$CORE value. The monetary report shows production values (in-cycle and not in-cycle process times) vs. lost production values (plant shutdown, scheduled downtime, delay time, repair time). The summary report shows the values reflected in the monetary report, but includes the aggregate values for each machine. This allows machine-to-machine comparisons for a selected timeframe.
Caterpillar is one of many companies using the software. At one of its East Peoria, Ill., plants, the company has a large population of numerous brands of manufacturing assets with various control types and ages. Caterpillar tried other asset-monitoring packages, but they often required proprietary hardware and PLC logic or part-program modifications, resulting in lengthy integration times and inconsistent or inaccurate data.
Twelve months after implementing eLOG, the plant calculated it recovered $1.2 million in productivity by cutting the average length of delays in half and increasing in-cycle times by 30 percent on machines equipped with the software. Delay times dropped 59 percent per occurrence, setup times dropped 39 percent and quality-lab delays dropped 31 percent per occurrence.
Monitoring manual machines is also possible. The Freedom Digital Interface with its integral MTConnect adapter brings legacy equipment online for asset monitoring. This small, DIN-rail-mounted device has eight digital inputs (24 VDC or 120 VAC) and two analog inputs (0-10 VDC). An onboard adapter transmits an SHDR (Simple Hierarchical Data Representation) signal to the user's MTConnect agent.
The cloud-based software, which complies with AMT's MTConnect communications protocol, is suitable for small shops as well as global enterprises, where it can connect with enterprise resource planning and other programs and be accessed via a smartphone or tablet.

